OpenTelemetry can auto-instrument many common modules for a Javascript application. The telemetry data captured can then be sent to SigNoz for analysis and visualization.
OpenTelemetry is a set of tools, APIs, and SDKs used to instrument applications to create and manage telemetry data(Logs, metrics, and traces). For any distributed system based on microservice architecture, it's an operational challenge to solve performance issues quickly.
Telemetry data helps engineering teams to troubleshoot issues across services and identify the root causes. In other words, telemetry data powers observability for your distributed applications.
Steps to get started with OpenTelemetry for a Nodejs application:
- Creating a SigNoz cloud account
- Setting Up the OpenTelemetry Collector
- Creating a Sample Nodejs application
- Instrumenting the Application with OpenTelemetry
- Viewing the Telemetry Data in SigNoz
Creating a SigNoz Cloud Account
To begin monitoring your applications with SigNoz, start by creating an account on the SigNoz platform. SigNoz cloud is the easiest way to run SigNoz. Sign up for a free account and get 30 days of unlimited access to all features.

You can also install and self-host SigNoz yourself since it is open-source. With 19,000+ GitHub stars, open-source SigNoz is loved by developers. Find the instructions to self-host SigNoz.
In this tutorial, we will be using SigNoz cloud. Once your account setup is complete, you’ll receive an email with a URL to access the SigNoz UI. Use this URL to log in and access your personalized dashboard.
Creating a Sample Nodejs application
This section guides you through setting up a basic Node.js application, instrumenting it with OpenTelemetry, and sending telemetry data to SigNoz.
Prerequisites
- Node.js version 12 or newer. Download the latest version of Node.js here.
Quick Start
To avoid manual setup, clone the sample Node.js app repository, which is pre-configured with OpenTelemetry instrumentation. However, to fully understand the process, you are recommended to follow the steps below.
Steps to Build the Application
For the sample application, let's create a basic 'hello world' express.js application.
Verify Node installation
Check if Node.js is installed:
node -vCreate a Project Directory and Install Dependencies
Create a directory for your app and install the required packages:
mkdir sample-node-app cd sample-node-app npm i express corsexpress: A minimalist web framework for Node.js, used to create the HTTP server.cors: A middleware to handle Cross-Origin Resource Sharing (CORS) issues.
Write Your Application Code
Create a file named
index.jsin your directory and add the following code:const express = require("express"); const cors = require('cors') const PORT = process.env.PORT || "5555"; const app = express(); app.use(cors()); app.use(express.json()) app.all("/", (req, res) => { res.json({ method: req.method, message: "Hello World", ...req.body }); }); app.get('/404', (req, res) => { res.sendStatus(404); }) app.listen(parseInt(PORT, 10), () => { console.log(`Listening for requests on http://localhost:${PORT}`); })This creates a very simple “Hello World” application.
Code Breakdown:
- Creates a simple server using
express. - Defines two routes:
/: Responds with a JSON payload./404: Responds with a 404 status code.
- The server listens on port
5555or an environment-specified port.
- Creates a simple server using
Run the Application
Start the server with:
node index.jsVisit http://localhost:5555/ to confirm the app is running.

Node application running Once you have confirmed it works, exit the application by using
Ctrl + Con your terminal.
Set up OpenTelemetry and Send Data to SigNoz
SigNoz offers various instrumentation methods to help you send telemetry data from your application to SigNoz Cloud for comprehensive monitoring and analysis. In this tutorial, we will utilize the No Code Automatic Instrumentation method, which simplifies the process by collecting telemetry data without requiring code changes.
Install OpenTelemetry Packages
To enable telemetry data collection for your application, you need to install the necessary OpenTelemetry packages. Use the following commands:
npm install --save @opentelemetry/api
npm install --save @opentelemetry/auto-instrumentations-node
These libraries enable automatic instrumentation and interaction with the OpenTelemetry API.
Configure Environment Variables
✅ InfoThese environment variables are applicable for SigNoz cloud. You don't need Ingestion key if you're using self-hosted SigNoz. For self-hosted SigNoz, please refer to instructions here.
To configure OpenTelemetry for your application, export the necessary environment variables. These variables define the data export settings and identify your application in SigNoz.
Run the below in your terminal:
export OTEL_TRACES_EXPORTER="otlp"
export OTEL_EXPORTER_OTLP_TRACES_ENDPOINT="<SIGNOZ_ENDPOINT>"
export OTEL_NODE_RESOURCE_DETECTORS="env,host,os"
export OTEL_SERVICE_NAME="<APP_NAME>"
export OTEL_EXPORTER_OTLP_HEADERS="signoz-ingestion-key=<SIGNOZ_INGESTION_KEY>"
export NODE_OPTIONS="--require @opentelemetry/auto-instrumentations-node/register"
Here is a breakdown of the environment variables used:
Variable Description OTEL_TRACES_EXPORTERSpecifies the traces exporter. Set to "otlp"to use the OpenTelemetry Protocol (OTLP) for exporting trace data.OTEL_EXPORTER_OTLP_TRACES_ENDPOINTThe SigNoz ingestion URL. You should have received this URL via email after registering with SigNoz Cloud. OTEL_NODE_RESOURCE_DETECTORSIdentifies additional resource metadata such as environment, host, and OS for better trace context. OTEL_SERVICE_NAMEThe name of your application. This will appear in SigNoz as the service being monitored. OTEL_EXPORTER_OTLP_HEADERSContains authentication headers, including your SigNoz ingestion key. NODE_OPTIONSConfigures the Node.js runtime to preload OpenTelemetry's auto-instrumentation library. Be sure to replace
<SIGNOZ_INGESTION_KEY>with your actual SigNoz ingestion key. If you haven't created one yet, you can follow this guide to generate your access key.
Variables exported Start the Application
After setting the environment variables, start your application by running:
node index.jsYou can check your application running at http://localhost:5555/.
You need to generate some load in order to see data reported on SigNoz dashboard. Refresh the endpoint for 10-20 times, and wait for 2-3 mins.
Monitoring your Application in SigNoz
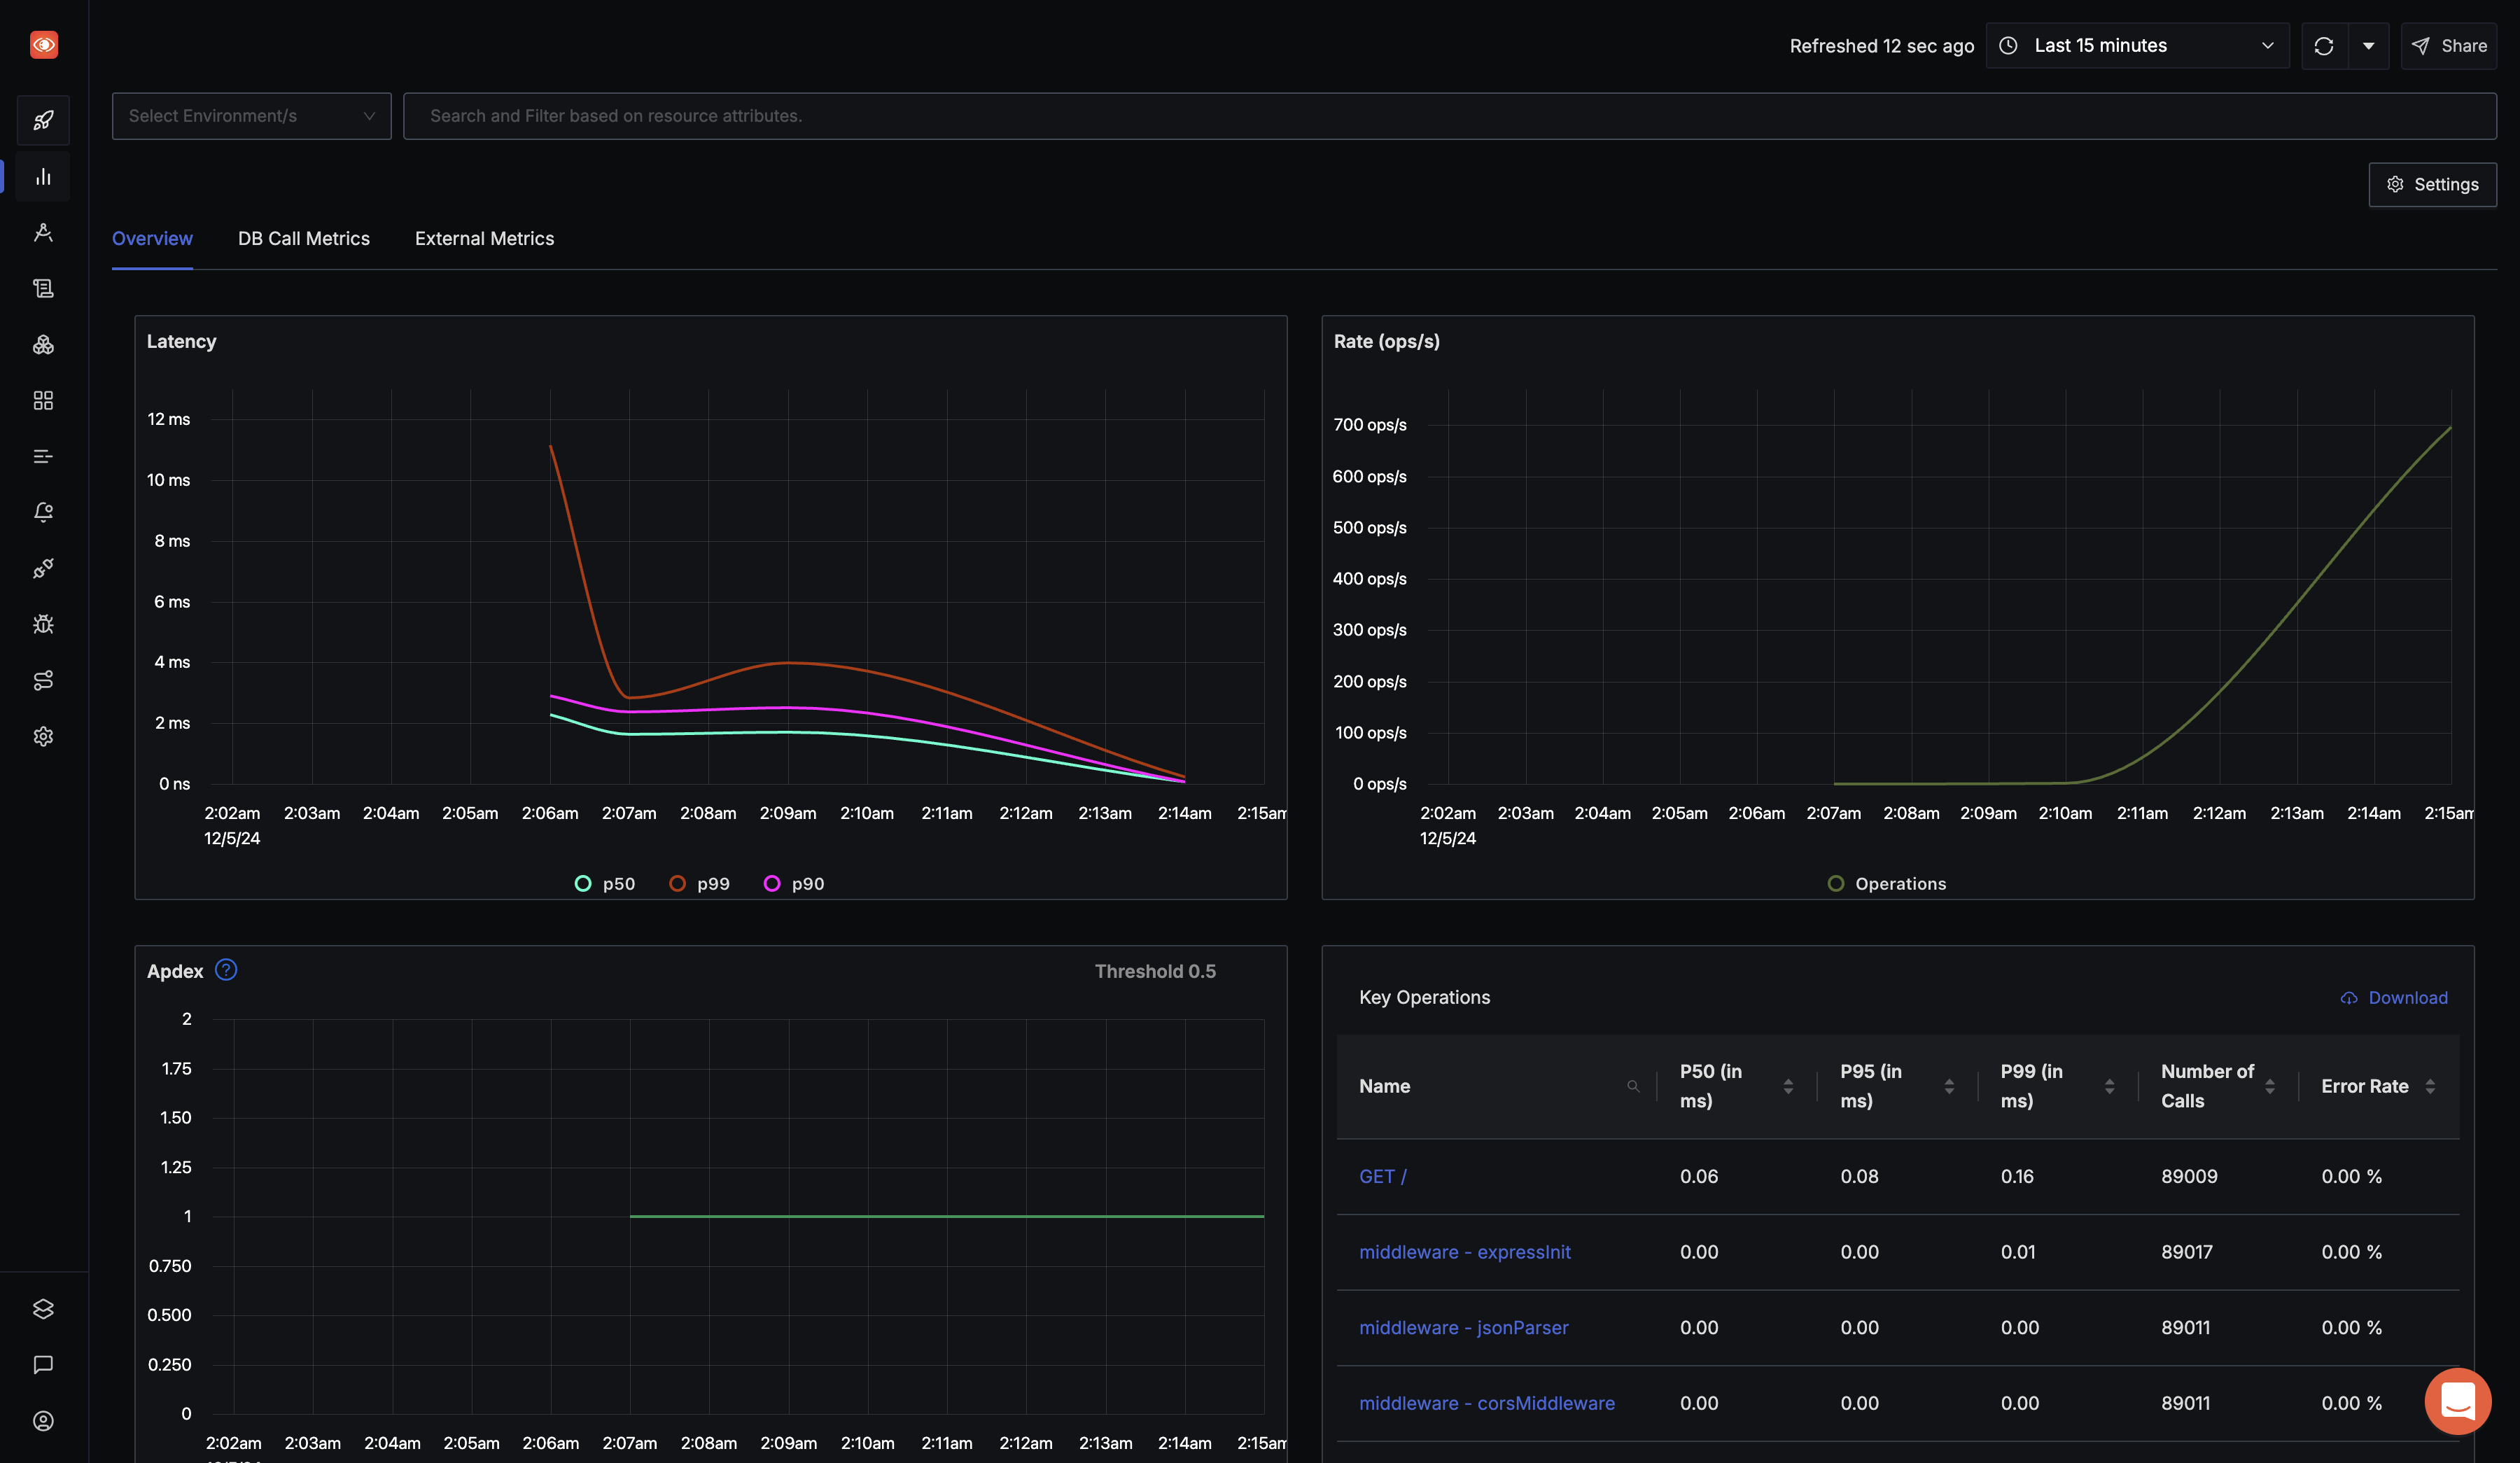
Once your application is running and has generated some load, you can begin monitoring it in your SigNoz Cloud account. Navigate to the Services tab, you should see your application listed.

SigNoz makes it easy to visualize metrics and traces captured through OpenTelemetry instrumentation. It comes with out-of-box RED metrics charts and visualization. RED metrics stand for:
- Rate of requests
- Error rate of requests
- Duration taken by requests
Click on your application in the Services tab to be redirected to the Metrics page, where you can explore these metrics in detail.
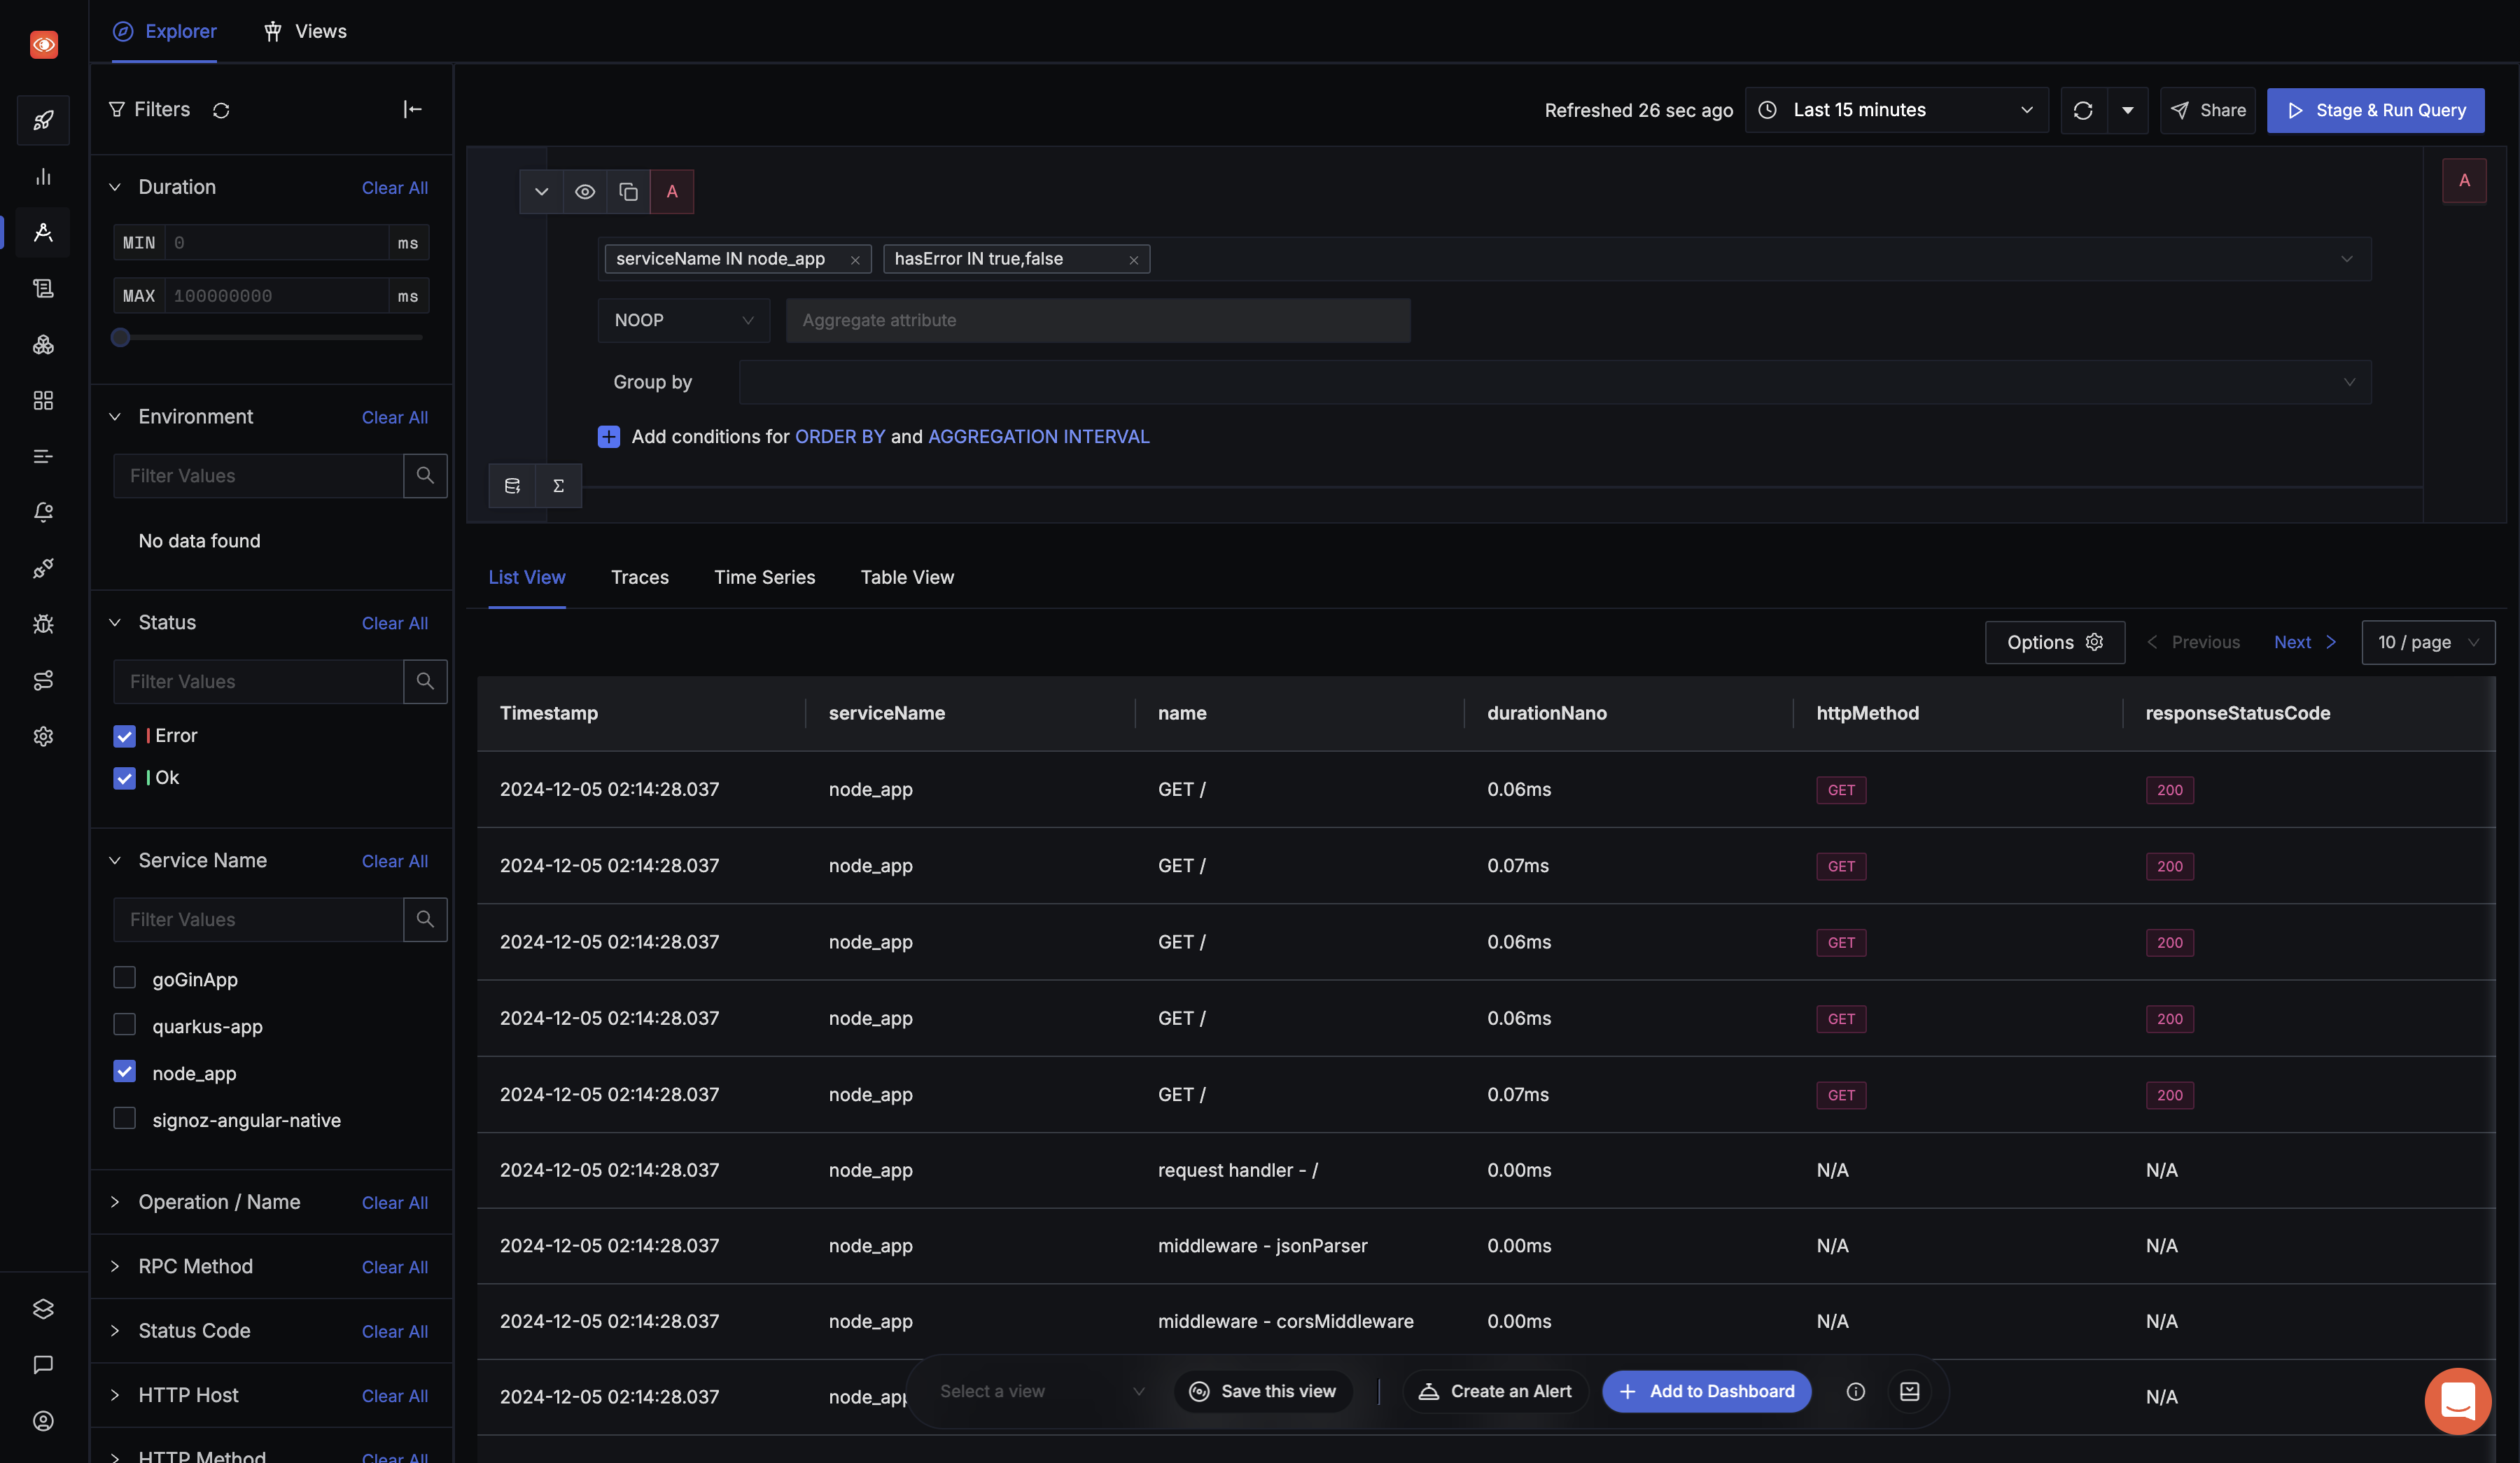
For more detailed analysis, navigate to the Traces tab. Here, you choose a particular timestamp where latency is high to drill down to traces around that timestamp to investigate the root cause. Additionally, you can apply filters to narrow down the data, focusing on specific spans, error types, or request paths, which allows for a more targeted investigation of performance bottlenecks or issues in your application.
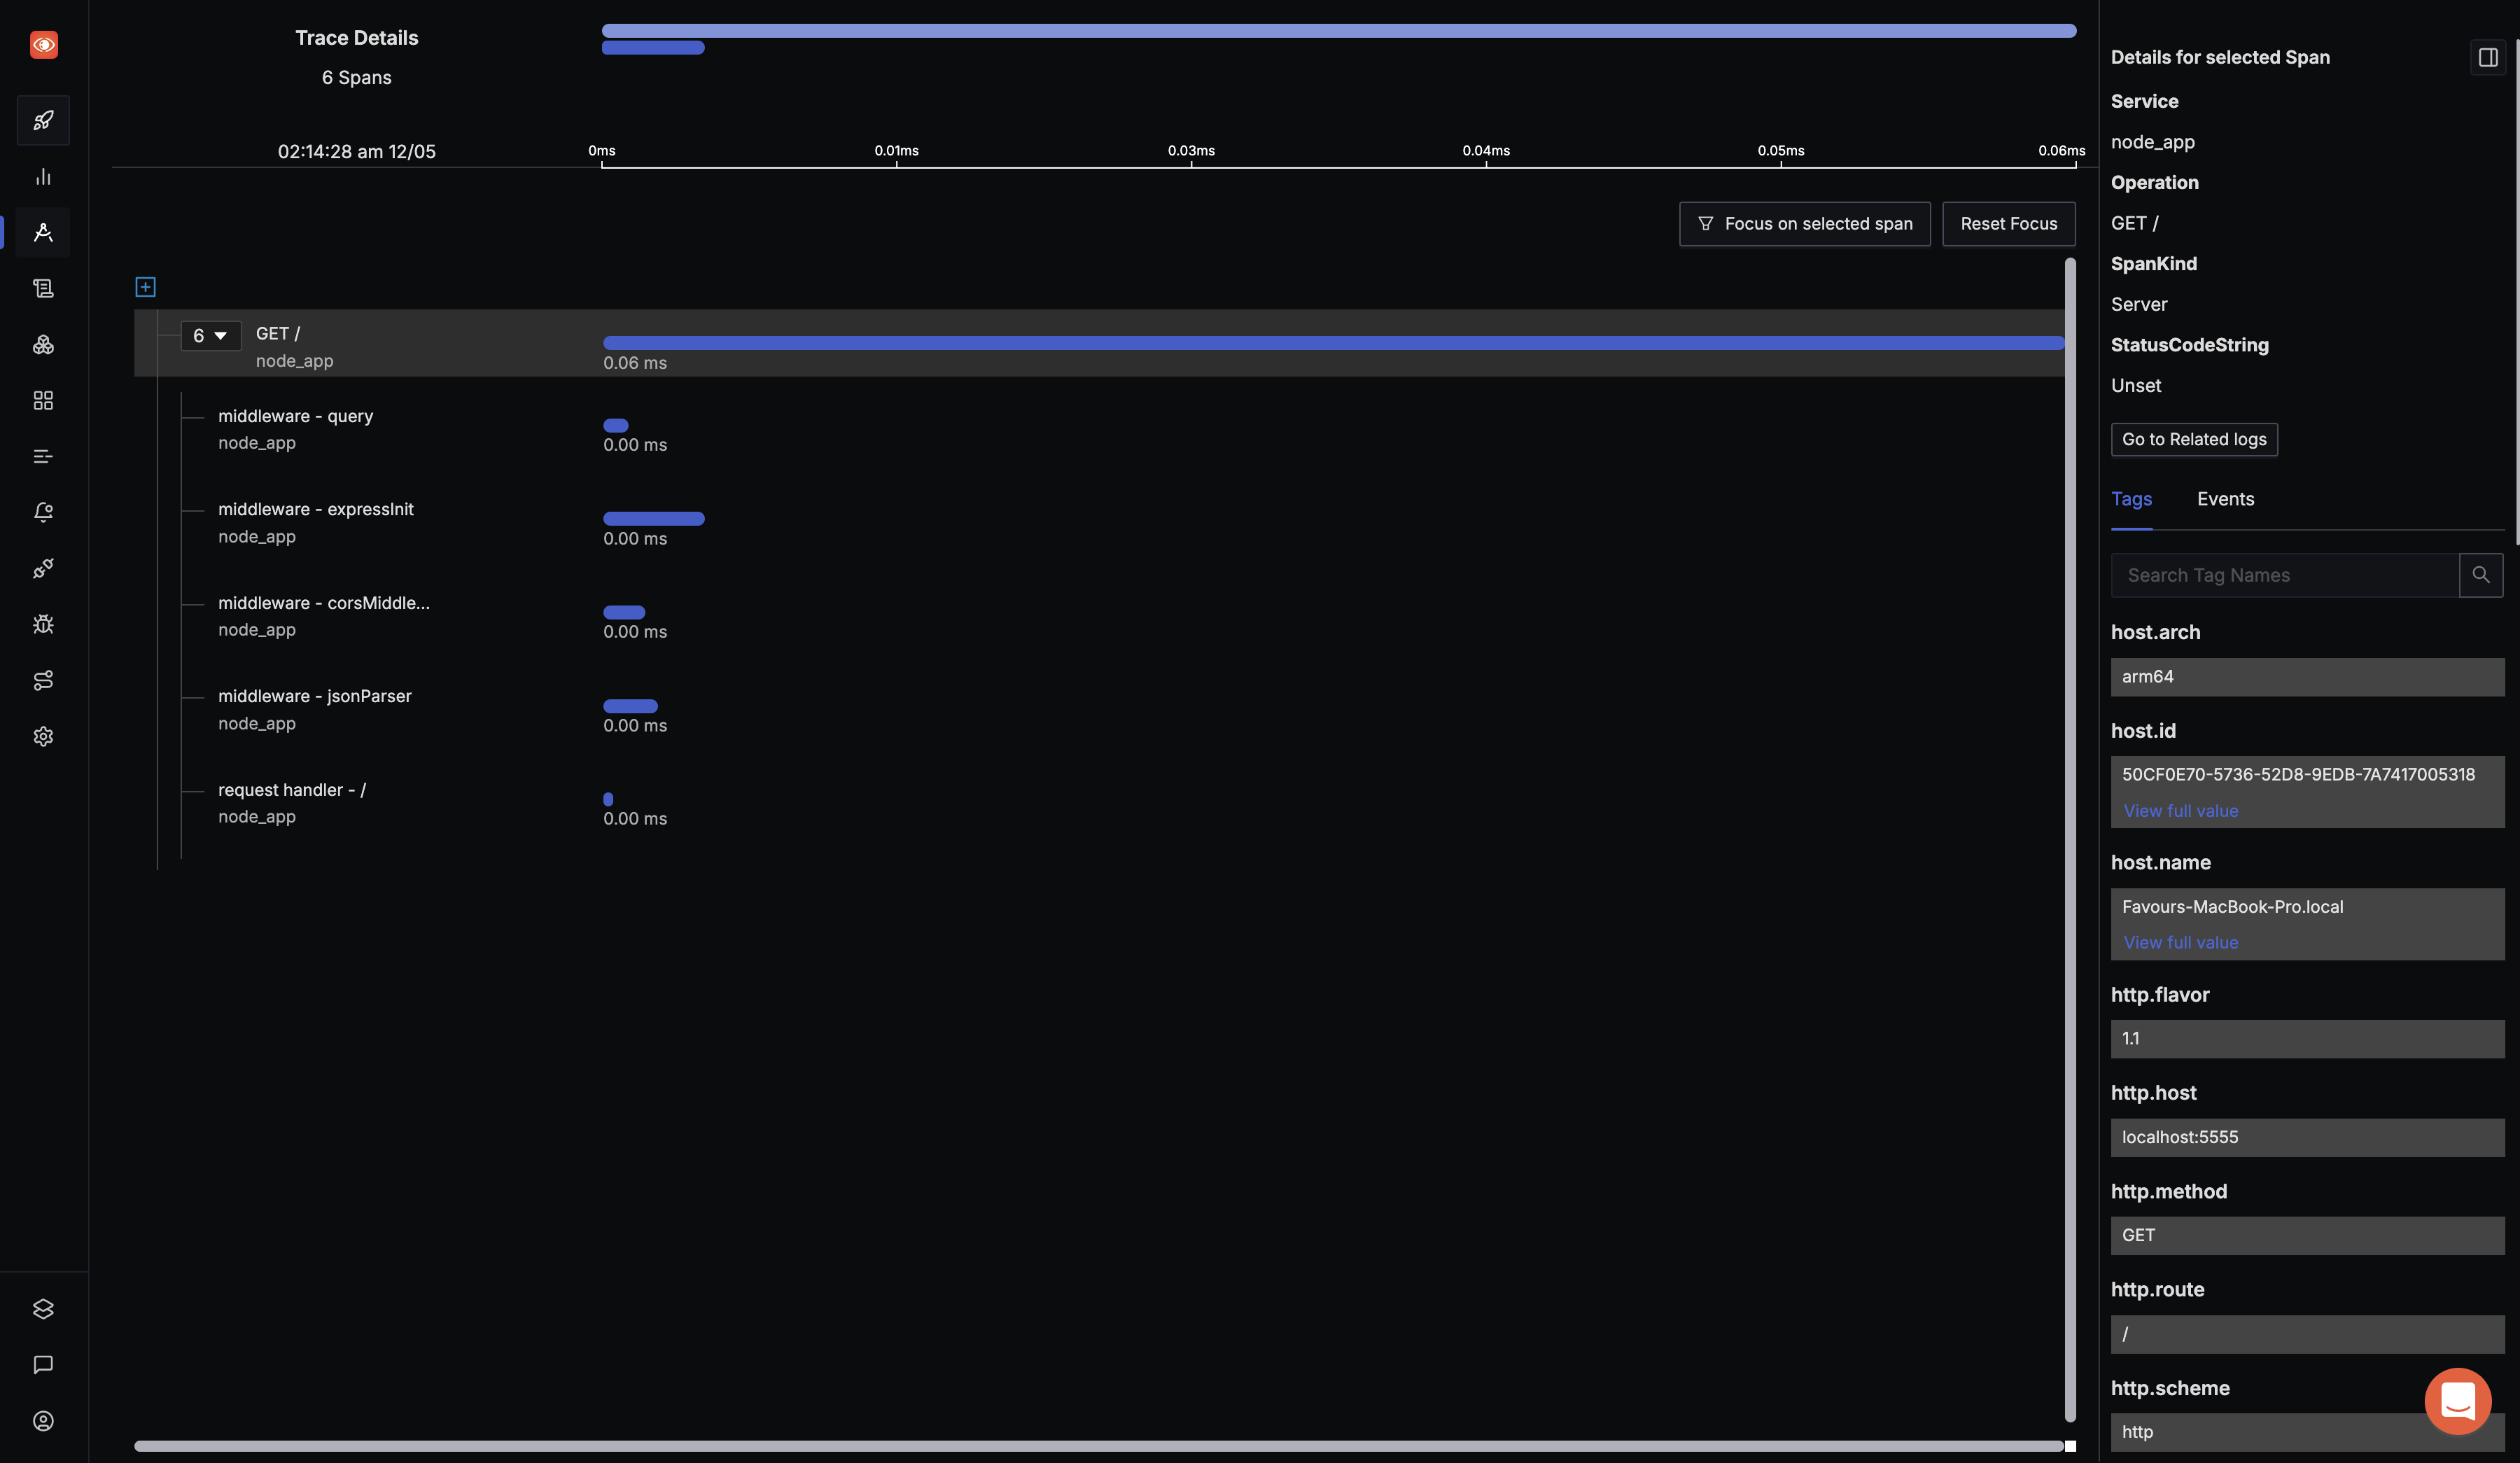
SigNoz provides flamegraphs, which are an invaluable tool for visualizing the exact duration taken by each span in a trace. Flamegraphs allow you to pinpoint which parts of your application are contributing to high latency.
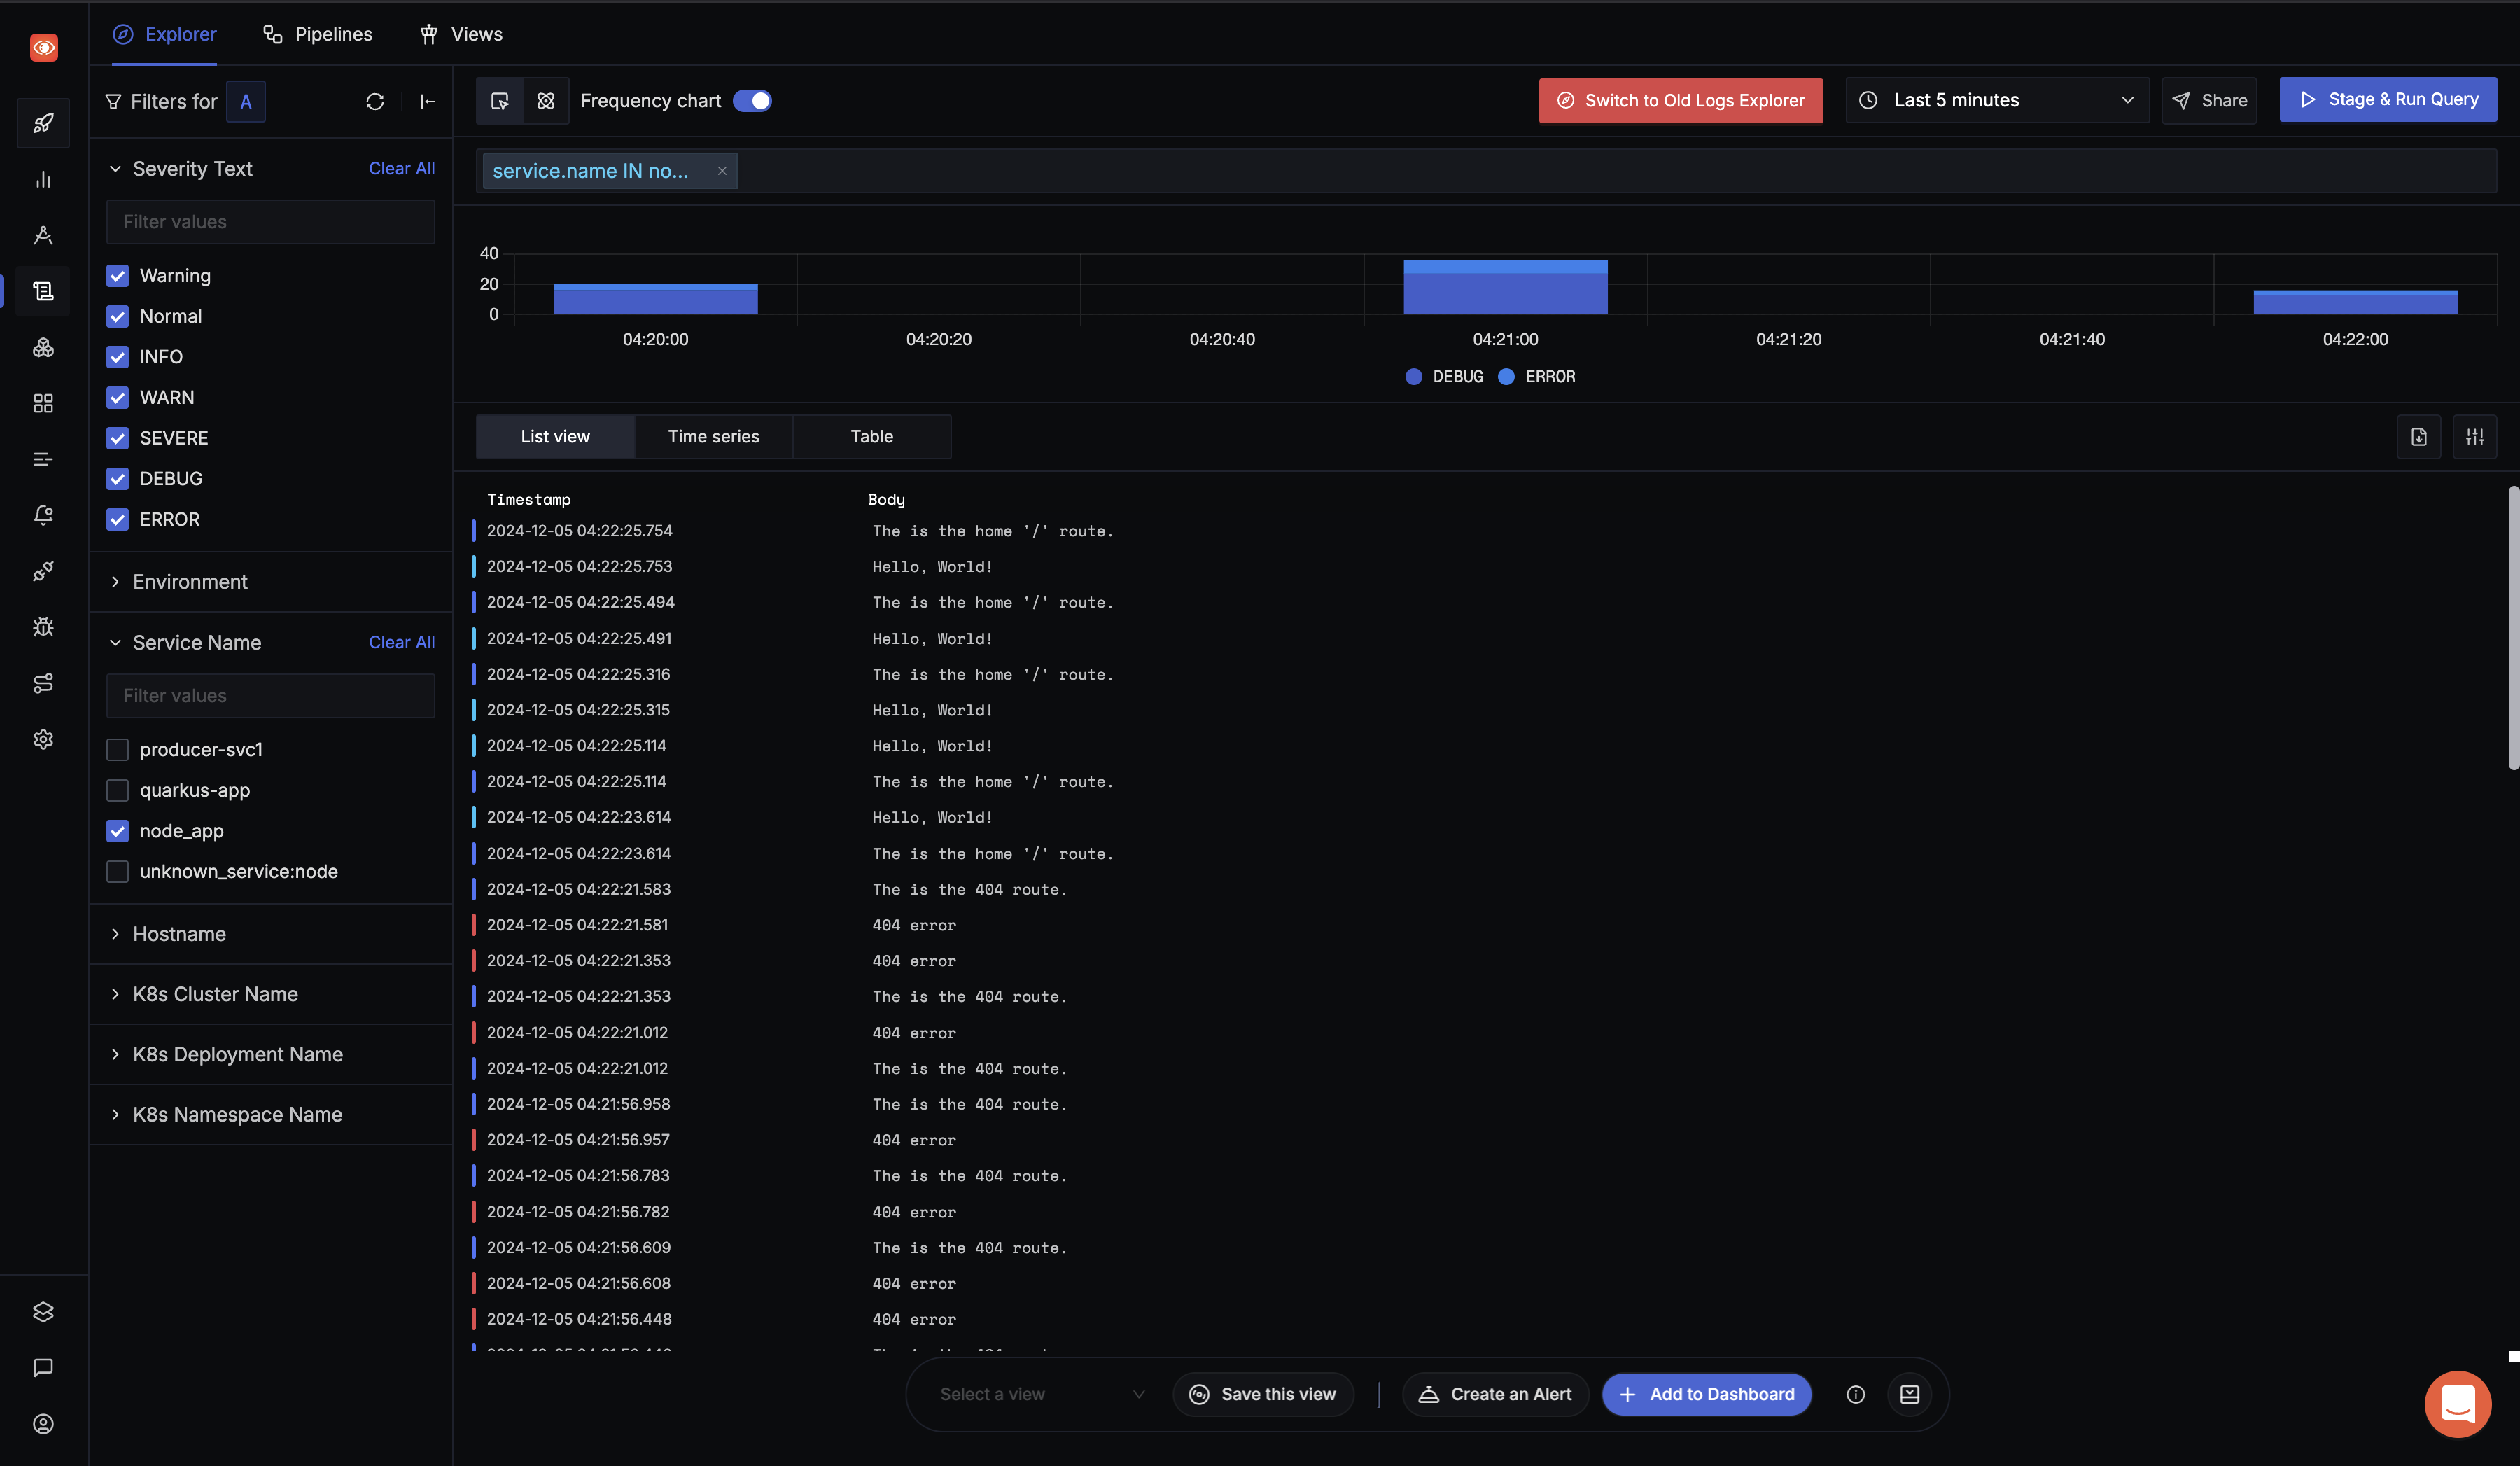
SigNoz can also be used for log management. For Node.js applications, you can use the winston logger to send logs to SigNoz.
Conclusion
OpenTelemetry makes it very convenient to instrument your Nodejs application. You can then use an open-source APM tool like SigNoz to analyze the performance of your app. As SigNoz offers a full-stack observability tool, you don't have to use multiple tools for your monitoring needs.
SigNoz cloud is the easiest way to run SigNoz. Sign up for a free account and get 30 days of unlimited access to all features.

You can also install and self-host SigNoz yourself since it is open-source. With 19,000+ GitHub stars, open-source SigNoz is loved by developers. Find the instructions to self-host SigNoz.
If you want to read more about SigNoz 👇
Implementing OpenTelemetry in an Angular application

