Cloud computing has revolutionized the way businesses operate, offering unparalleled scalability and flexibility. However, with these benefits comes the challenge of managing costs effectively. As cloud adoption continues to surge, organizations find themselves grappling with escalating expenses. How can you harness the power of the cloud without breaking the bank? This article presents 10 proven strategies to optimize your cloud costs, ensuring you maximize value while minimizing expenditure.
What is Cloud Cost Optimization?
Cloud cost optimization focuses on allocating the most efficient and cost-effective resources to workloads, balancing performance, cost, compliance, and security to ensure investments align with organizational needs. Since each workload is unique and evolves over time, optimization requires setting performance thresholds based on metrics and domain expertise to reduce costs without compromising performance. This dynamic process adapts to shifting application demands and cloud pricing options, relying on detailed analytics, metrics, and automation to navigate the complexity of cloud environments.
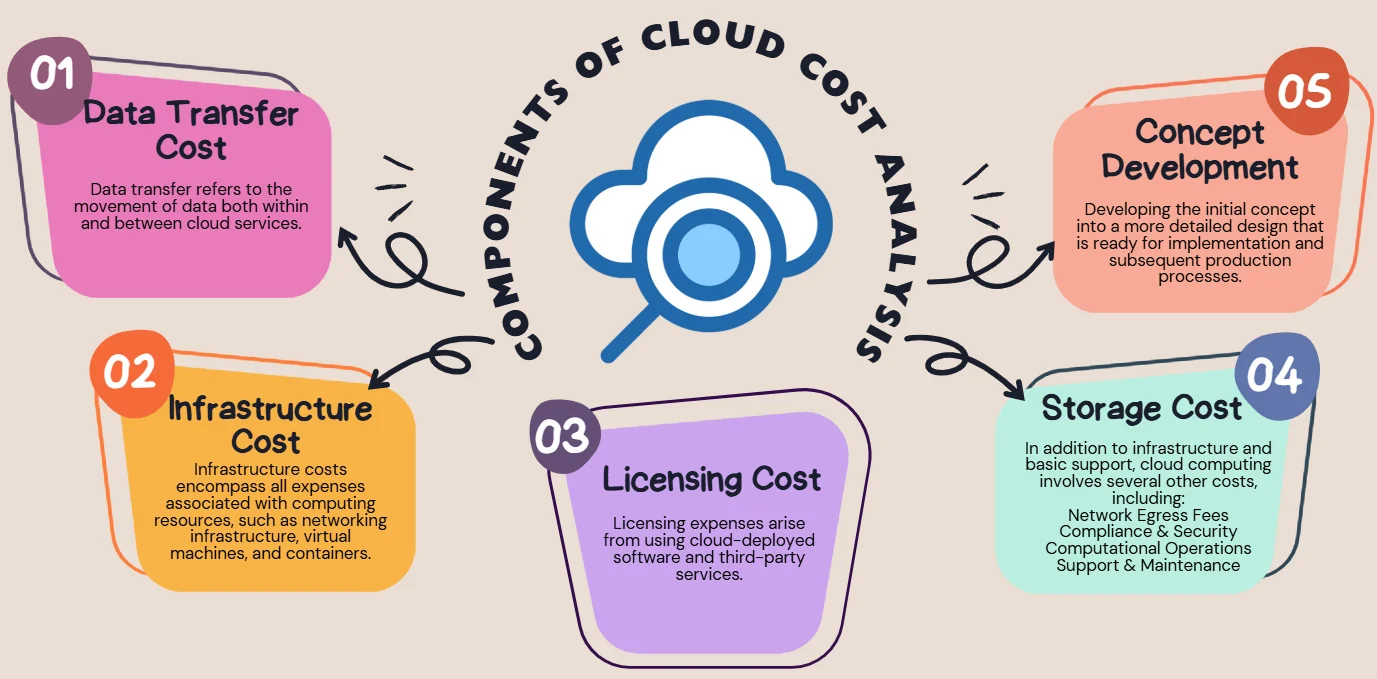
Optimizing cloud costs may include the following steps:
Resource Management: Efficient resource management ensures that cloud resources are allocated based on actual needs, avoiding overprovisioning or underutilization.
This involves monitoring usage and adjusting resources dynamically to maintain efficiency and minimize waste.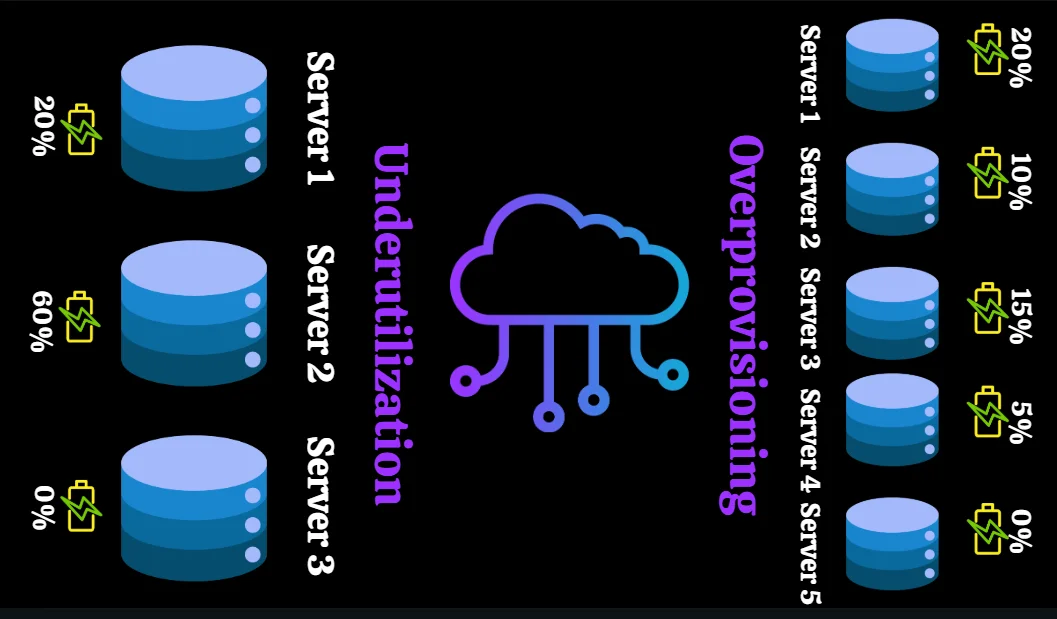
Pricing Models: Cloud providers offer diverse pricing options, such as on-demand, reserved, and spot instances, to cater to different needs. Choosing the right pricing model based on workload requirements can significantly lower costs while maintaining service quality.
Usage Patterns: Understanding how cloud services are consumed helps identify inefficiencies and areas for improvement. By analyzing usage trends, organizations can optimize workloads, eliminate redundancies, and plan for scaling during peak demand.
However, challenges such as complexity, lack of visibility, and rapid technological changes can make optimization a daunting task.
Cloud Cost Optimization VS Cloud Cost Management
As organizations increasingly rely on cloud services, managing and optimizing cloud expenses has become essential. However, understanding the difference between cloud cost management and cloud cost optimization is key to effective financial oversight. Cloud cost management refers to the broader practice of monitoring, analyzing, and controlling cloud spending to stay within budget and ensure accountability. It involves creating policies, setting budgets, and generating detailed cost reports. In contrast, cloud cost optimization focuses on refining how cloud resources are used to maximize efficiency and minimize waste. By introducing these concepts, businesses can develop a balanced approach that combines strategic cost control with practical efficiency improvements.
Let’s look at a tabular comparison of the same:
| Factors | Cloud Cost Optimization | Cloud Cost Management |
|---|---|---|
| Focus | Maximizing business value while minimizing costs. | Tracking, allocating, and analyzing cloud spend. |
| Primary Goal | Align costs with business goals and drive profitability. | Monitor and control spending. |
| Revenue Correlation | Higher costs are acceptable if they drive higher revenue or profitability. | Not necessarily linked to revenue generation. |
| Key Requirement | Actionable cloud cost intelligence for proactive decision-making. | Detailed reports and spending insights. |
| Outcome | Ensures costs are productive and lead to business growth. | Ensures controlled and transparent cloud expenditure. |
Why Cloud Cost Optimization is Crucial for Businesses
Cloud computing costs can vary widely across services and vendors. With on-demand resources, organizations can scale quickly, while automation enhances efficiency. However, managing these costs requires a clear understanding of the factors driving them, a strategic plan tailored to business needs, and continuous monitoring to optimize usage and billing. To support this, cloud vendors offer various pricing models and cost management tools.
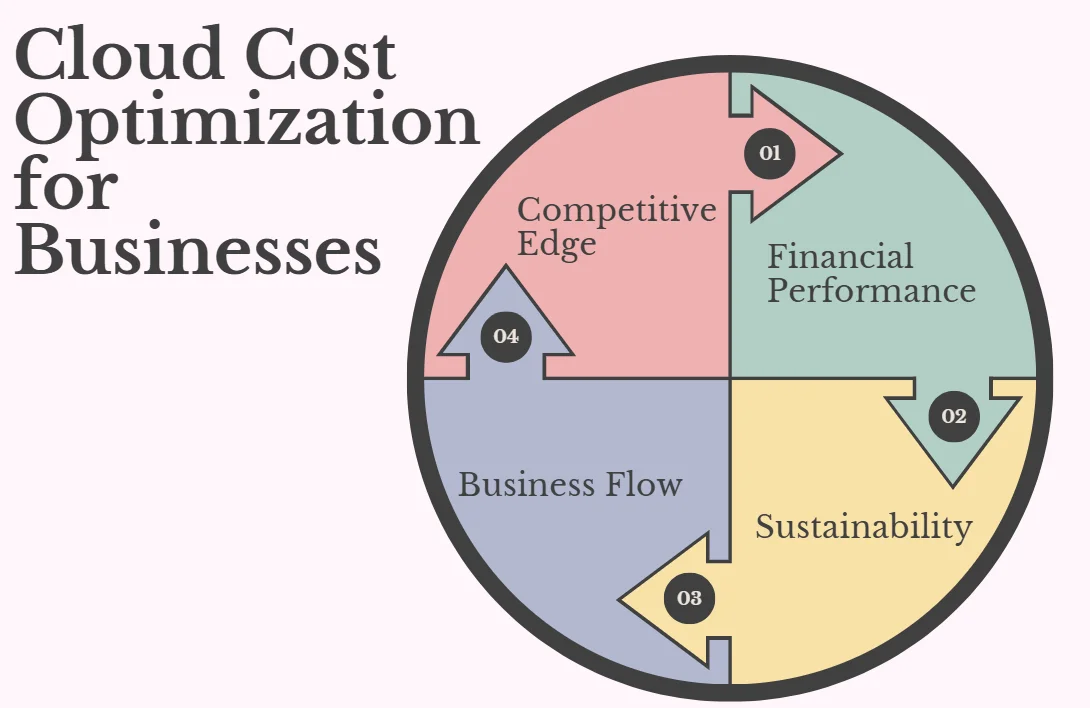
As cloud spending continues to grow rapidly, it’s becoming a major factor in business budgets. Gartner projects global end-user spending on public cloud services to hit $597.3 billion in 2023, emphasizing the need for effective cost control strategies.
Cloud cost optimization enhances financial performance, drives sustainability, and boosts business resiliency. It frees up resources for innovation, supports ESG goals by reducing waste, and ensures continuity through better resource distribution and quick recovery during disruptions. Let's dive deeper into the benefits of cloud cost optimization.
Benefits of Cloud Cost Optimization
- Improved Operational Efficiency: Underused resources, poor application optimization, and mismanaged cloud assets can inflate operational costs significantly. For instance, an e-commerce business might maintain maximum server capacity 24/7 to handle peak traffic during sales, yet those servers may run at just 10% capacity during off-peak hours, wasting up to 90% of the spend. Tools like rightsizing and autoscaling help identify and consolidate underutilized or overprovisioned resources, reducing waste while improving application performance. The savings can be reinvested into higher ROI areas, such as customer acquisition or product development.
- Reduced Waste and Unnecessary Spending: Cloud cost optimization fosters a culture of cost awareness, enabling teams to evaluate the value of their spending and make data-driven decisions. By implementing best practices, companies can eliminate guesswork and achieve substantial savings. For example, McKinsey Digital reports that effective cloud cost optimization can help organizations cut 15-25% of cloud program costs without sacrificing value.
- Increased Return on Investment (ROI): Cloud cost optimization isn’t just about cutting expenses; it’s a strategic approach to maximizing the value of cloud investments. This involves reducing costs without compromising security, system performance, or development speed, ensuring cloud resources contribute directly to business goals and outcomes.
- Reduced Security Risks: While not the core focus of security programs, cloud cost optimization can enhance security by eliminating overprovisioned and idle resources that expand the attack surface. Increased visibility from monitoring cloud usage helps identify potential vulnerabilities. Tools like autoscaling and infrastructure as code (IaC) ensure consistent enforcement of security controls and reduce risks from misconfigurations. This proactive approach supports both cost savings and stronger security postures.
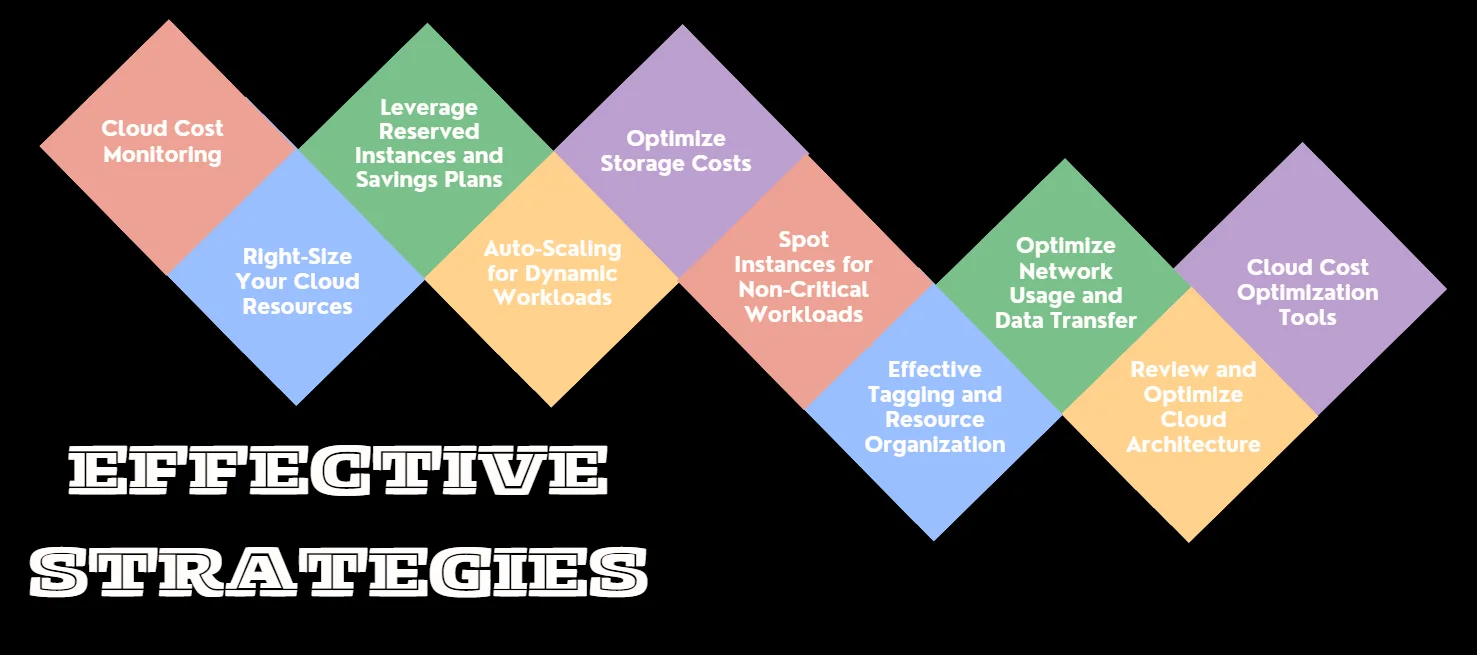
Strategy 1: Implement Comprehensive Cloud Cost Monitoring
Effective cloud cost optimization begins with visibility. Real-time monitoring of cloud spending is essential for identifying cost-saving opportunities and preventing budget overruns. With so many instance options available, cloud administrators can inadvertently opt for too much computing power. In addition, developers can easily create compute instances, load balancers, storage volumes, and other cloud resources as needed—but they may forget to deprovision these resources when a project ends. Depending on their payment plans, companies may be charged for unused or idle resources, ultimately paying for more than they need.
Key aspects of comprehensive cloud cost monitoring include:
- Tracking usage patterns: Understand how and when resources are consumed.
- Identifying idle resources: Spot and eliminate unused or underutilized assets.
- Detecting cost anomalies: Quickly identify and address unexpected spikes in spending.
Implement robust monitoring tools and dashboards to gain insights into your cloud costs. Set up alerts and thresholds to proactively manage expenses before they escalate.
Strategy 2: Right-Size Your Cloud Resources
Right-sizing is the process of aligning instance types and sizes with workload performance and capacity needs, making it a key aspect of cloud cost optimization. Over-provisioned resources often lead to unnecessary expenses, so identifying and modifying underutilized resources is essential. This involves analyzing application usage patterns and performance metrics, typically using cloud cost management tools. Regular monitoring helps pinpoint mismanaged resources, enabling businesses to adjust them to better suit workload demands. For instance, a memory-optimized instance running compute-heavy tasks due to changes in application requirements could be replaced with a compute-optimized instance, significantly reducing costs.
To effectively right-size your cloud resources:
- Identify instances that are consistently underutilized: Identify instances with low resource utilization, such as virtual machines running at under 30% CPU. These can often be downsized to save costs without affecting performance.
- Adjust instance types or sizes to match actual needs: Based on usage data, adjust the size or type of instances to better match workload requirements. This ensures you are not overpaying for unused resources.
- Implement automated right-sizing tools for continuous optimization: Use autoscaling and Infrastructure as Code (IaC) tools to continuously adjust resources based on demand. Autoscaling automatically adapts server sizes, while IaC ensures new instances are provisioned optimally from the start.
Remember: Right-sizing is an ongoing process. Regularly review and adjust your resources as workload demands change.
Strategy 3: Leverage Reserved Instances and Savings Plans
Most cloud providers offer discount programs to help businesses lower cloud spending, though eligibility depends on the type of workload. Reserved Instances (RIs) provide significant cost savings, when companies commit to using specific instance types for a set period, usually one to three years. While ideal for stable, predictable workloads like continuously running mission-critical applications, RIs require up-front payment and a clear understanding of long-term usage to avoid overcommitment. However, they may not suit dynamic or unpredictable workloads.
Savings Plans offer a more flexible alternative, allowing businesses to commit to spending a fixed amount, typically per hour, regardless of instance type or region. Unlike RIs, which lock in capacity and instance types, savings plans accommodate changing needs while still delivering significant cost reductions. These plans are well-suited for companies with consistent cloud spending projections but evolving resource requirements. Together, RIs and savings plans provide powerful tools for optimizing cloud budgets.
To maximize savings:
- Analyze your usage patterns to determine suitable commitment levels.
- Choose between RIs and Savings Plans based on your flexibility needs.
- Consider a mix of 1-year and 3-year commitments to balance savings and agility.
- Regularly review and adjust your reservations to align with changing requirements.
Tip: Use RI utilization reports to ensure you're maximizing the value of your commitments.
Strategy 4: Implement Auto-Scaling for Dynamic Workloads
Automation tools like autoscaling and Infrastructure as Code (IaC) are game changers when it comes to rightsizing resources efficiently. While we’ve already touched on IaC, let’s focus on autoscaling. Most cloud providers offer this feature, which automatically adjusts server instances and storage based on your needs. Imagine a retailer ramping up resources during the holiday rush and scaling back down once the season ends—that’s the power of autoscaling. A great example is Star CRM, which uses autoscaling in Oracle Cloud Infrastructure (OCI) to handle traffic spikes during peak periods, ensuring they only pay for extra compute power when they actually need it.
This approach is especially effective for workloads that experience variable or unpredictable usage, ensuring businesses maintain performance while avoiding expenses for idle resources.
To implement effective auto-scaling:
- Define appropriate scaling metrics (e.g., CPU utilization, request count).
- Set up scaling policies with suitable thresholds.
- Configure cooldown periods to prevent rapid scaling fluctuations.
- Regularly test and refine your auto-scaling configurations.
Here’s an example of a YAML configuration for setting up an Auto Scaling Group in a cloud environment.
AutoScalingGroup:
  MinSize: 2
  MaxSize: 10
  DesiredCapacity: 2
  ScalingPolicies:
    - ScalingAdjustment: 1
      AdjustmentType: ChangeInCapacity
      Cooldown: 300
      MetricAggregationType: Average
      PolicyType: SimpleScaling
In this example, the auto scaling group starts with 2 instances and can scale up to 10 as required. We’ve also set the ideal capacity to 2. The scaling policy adjusts the number of instances based on workload metrics, whenever scaling occurs, it increases or decreases the capacity by 1 instance. This is done using a SimpleScaling policy, which uses the average of the monitored metrics to make decisions. To avoid too many scaling actions in a short period, we have included a cooldown period of 300 seconds, this ensures smooth and stable scaling.
Strategy 5: Optimize Storage Costs
Storage often represents a significant portion of cloud costs. Optimizing storage can lead to substantial savings without compromising data accessibility or integrity.
Key strategies for storage cost optimization include:
- Implement tiered storage: Move infrequently accessed data to lower-cost storage tiers.
- Enable data lifecycle management: Automatically transition or delete data based on predefined rules.
- Use compression and deduplication: Reduce the amount of data stored and transferred.
- Leverage object storage: Utilize cost-effective object storage for large-scale, unstructured data.
Here’s an example to illustrate a lifecycle policy in AWS S3:
{
  "Rules": [
    {
      "Status": "Enabled",
      "Transitions": [
        {
          "Days": 30,
          "StorageClass": "STANDARD_IA"
        },
        {
          "Days": 60,
          "StorageClass": "GLACIER"
        }
      ],
      "Expiration": {
        "Days": 365
      }
    }
  ]
}
This JSON code sets up an S3 lifecycle policy to automatically manage the storage of your files. It starts by enabling the policy and then specifies how objects should be handled as they age.
- After 30 days: objects are moved to the STANDARD_IA storage class, which is cheaper for data that’s accessed less frequently.
- After 60 days: they’re transitioned to GLACIER, a very low-cost storage option for data that needs to be archived.
- After 365 days: they will be automatically deleted.
This setup helps you save on storage costs by moving data to cheaper options over time and removing old, unnecessary files.
Strategy 6: Utilize Spot Instances for Non-Critical Workloads
Spot instances operate like cloud auctions, where CSPs sell their unused resources at significantly reduced rates—sometimes up to 90% less than on-demand pricing. These instances are perfect for workloads that are fault-tolerant and flexible, such as batch processing, big data analytics, or rendering tasks.
However, they come with certain limitations. Spot instance availability and pricing are unpredictable, fluctuating based on demand and capacity. CSPs can reclaim these instances with little notice if your bid is exceeded or resources are no longer available. As a result, they are not suitable for mission-critical or time-sensitive applications. Instead, spot instances work best for workloads designed to handle interruptions gracefully, ensuring a seamless shift to alternate resources when needed.
To effectively use Spot Instances:
- Identify workloads suitable for interruption: Spot Instances are ideal for non-critical, flexible workloads that can tolerate interruptions, such as batch processing, data analysis, or background tasks. Identifying workloads that don’t require constant uptime allows us to take advantage of cheaper Spot Instances without affecting service reliability.
- Implement robust instance management: To manage potential interruptions, we can use auto-scaling and instance health checks to ensure that Spot Instances can be replaced quickly when terminated. We can set up Spot Instance interruption notifications to get a 2-minute warning before an instance is terminated. This allows us to gracefully shut down tasks or move them to other running instances.
- Use Spot Fleet to maintain target capacity across multiple instance types: A Spot Fleet enables us to request Spot Instances across various instance types and Availability Zones. By setting a target capacity and listing the preferred instance types, the Spot Fleet dynamically adjusts to meet our needs, ensuring capacity remains stable even if some Spot Instances are terminated. This approach offers flexibility while optimizing costs by selecting the most affordable available instances automatically.
- Combine Spot Instances with On-Demand or Reserved Instances for critical components: For mission-critical services that cannot tolerate interruptions, it’s best to combine Spot Instances with On-Demand or Reserved Instances. For example, if we are running a web application, we could use Spot Instances to handle traffic spikes while relying on On-Demand Instances for our core web server and database to ensure availability. This way, we can leverage cost savings without sacrificing performance or reliability.
Let’s look at an example of how we can define a Spot Fleet Request Configuration for launching and managing Spot Instances in AWS.
{
  "SpotFleetRequestConfig": {
    "AllocationStrategy": "capacityOptimized",
    "TargetCapacity": 10,
    "LaunchSpecifications": [
      {
        "InstanceType": "c5.large",
        "WeightedCapacity": 1
      },
      {
        "InstanceType": "m5.large",
        "WeightedCapacity": 1
      }
    ]
  }
}
In the above example, SpotFleetRequestConfig involves:
AllocationStrategy: The strategy chosen here iscapacityOptimized. This means the Spot Fleet will prioritize instances from pools with the least chance of interruption, improving the likelihood that your instances will stay running without termination due to high demand in other pools.TargetCapacity: The total number of Spot Instances you want to request is set to 10. This specifies the desired capacity for your Spot Fleet, which AWS will try to meet by launching instances.LaunchSpecifications: This section lists the types of instances that AWS can use to fulfill the requested capacity. In this case, two instance types are specified:c5.large: A compute-optimized instance type, with a weighted capacity of 1. This means onec5.largeinstance counts as 1 towards the total capacity.m5.large: A general-purpose instance type, also with a weighted capacity of 1.
The Spot Fleet will try to meet the target capacity of 10 by selecting c5.large and m5.large instances, using them in any combination that adds up to the desired capacity. By specifying multiple instance types, you provide flexibility in instance selection, ensuring your Spot Fleet can efficiently scale depending on availability and cost.
Strategy 7: Implement Effective Tagging and Resource Organization
Implementing a tagging strategy can significantly enhance cost management and resource optimization in the cloud. Cloud providers enable businesses to tag resources—such as by department, project, or environment—making it easier to categorize expenses and evaluate the ROI of specific cloud investments.
Effective tagging also supports automation for cost-saving measures and helps streamline resource allocation. By clearly tracking spending patterns and usage, organizations can make data-driven decisions, ensuring that cloud resources align with business priorities.
Best practices for tagging include:
- Develop a consistent naming convention: Establish a clear and standardized format for cloud tags, such as using lowercase letters with hyphens or underscores (e.g.,
environment-typeorcost_center). Ensure tag names are descriptive and meaningful, avoiding spaces, special characters, or reserved keywords for compatibility. Document and share the naming convention with all stakeholders to maintain consistency across resources. - Use automation to enforce tagging policies: Automate cloud tagging to maintain consistency and accuracy across your environment. Use Infrastructure as Code (IaC) tools like AWS CloudFormation, Azure Resource Manager, or Terraform to define and apply tags during resource provisioning. Additionally, leverage cloud provider APIs, SDKs, or CLI tools to programmatically tag resources during deployments. Enforce tagging policies to automatically apply or validate tags based on predefined rules.
- Implement mandatory tags for cost allocation: Define essential tags like
CostCenter,Owner, orProjectas mandatory to ensure every resource is linked to a specific team or initiative. This makes it easier to track spending and allocate costs to the correct departments or projects. Use tagging policies provided by your cloud provider, such as AWS Organizations Tag Policies or Azure Policy, to enforce mandatory tags and ensure compliance. - Leverage tags for automated resource management: Use tags to streamline operational tasks like scheduling resource start/stop times or setting lifecycle policies. For example, apply a tag such as
Schedule=NightShutdownand pair it with automation tools like AWS Lambda or Azure Automation to stop non-essential instances during off-hours. This reduces costs and optimizes resource utilization while ensuring critical workloads remain unaffected.
Let’s take an example to see how we can define a tagging policy for managing cloud resources within an AWS environment.
{
  "TagPolicy": [
    {
      "Tags": {
        "Project": "${aws:PrincipalTag/Project}",
        "Environment": ["Production", "Development", "Testing"],
        "Owner": "${aws:PrincipalTag/email}"
      },
      "EnforceForResources": [
        "AWS::EC2::Instance",
        "AWS::RDS::DBInstance"
      ]
    }
  ]
}
This policy automates and enforces consistent tagging practices, ensuring every tagged resource aligns with organizational standards. For example, a company can easily filter and track costs for all resources related to the Development environment or identify resource ownership via the Owner tag. Let’s understand this in-depth:
Tagpolicyspecifies a set of tags to be applied to AWS resources.Project: Dynamically inherits the value from the AWS principal's tag (aws:PrincipalTag/Project), ensuring that resources are associated with a specific project.Environment: Restricts the environment tag to one of the predefined values—Production,Development, orTesting. This ensures consistency across different resource environments.Owner: Dynamically derives the email of the resource owner from the AWS principal's tag (aws:PrincipalTag/email), promoting accountability.
EnforceForResourceslists the specific resource types where the tagging policy must be enforced:AWS::EC2::Instance: Applies the policy to EC2 instances, which are commonly used virtual machines.AWS::RDS::DBInstance: Enforces tagging on RDS database instances, which manage relational database
Strategy 8: Optimize Network Usage and Data Transfer
Network-related costs can be a major contributor to overall cloud expenses, but optimizing data transfer and usage can help mitigate them. Cloud providers often impose fees for moving data between regions, availability zones, or different services within their ecosystems. For businesses that frequently transfer or replicate data across these boundaries, such costs can accumulate rapidly.
Charges for data ingress (incoming data) are generally lower than those for data egress (outgoing data), making inefficient data retrieval, over-reliance on data transfers, or poor data lifecycle management costly. Additional factors, like redundant transfers, lack of data compression, or failing to deduplicate data, can further inflate network expenses. Identifying and addressing these inefficiencies can result in significant savings.
Key strategies include:
- Reduce cross-region data transfer: Minimize data movement between geographic regions by architecting your workloads to operate within the same region wherever possible. This involves placing compute, storage, and database resources in the same region and configuring services to minimize inter-region communication. Tools like AWS Cost Explorer or Azure Cost Management can help identify costly cross-region transfers.
- Implement Content Delivery Networks (CDNs): Use CDNs such as Amazon CloudFront or Azure CDN to cache content closer to end-users. This reduces latency, lowers data transfer costs from the origin server, and enhances user experience.
- Use Direct Connect or private links: For high-volume or sensitive data transfers, establish dedicated network connections such as AWS Direct Connect or Azure ExpressRoute. These private links bypass public internet traffic, offering lower latency, enhanced security, and reduced costs compared to standard internet-based transfers.
- Optimize application-level data transfer: Enhance efficiency by compressing data before transmission and using efficient serialization formats like Protocol Buffers or Avro. This reduces the amount of data transmitted over the network, saving bandwidth and improving performance.
Example CloudFront distribution configuration:
CloudFrontDistribution:
  DistributionConfig:
    Enabled: true
    DefaultCacheBehavior:
      ViewerProtocolPolicy: redirect-to-https
      MinTTL: 0
      DefaultTTL: 300
      MaxTTL: 1200
      ForwardedValues:
        QueryString: false
    PriceClass: PriceClass_100
Strategy 9: Continuously Review and Optimize Cloud Architecture
Cloud environments are dynamic, and your architecture should evolve to maintain optimal performance and cost-efficiency. Regular reviews and optimizations are essential for long-term cost management.
Key aspects of continuous optimization include:
- Conduct regular architecture reviews: Assess your current setup against best practices and new services.
- Eliminate unused or underutilized resources: Regularly audit and remove unnecessary assets.
- Evaluate serverless and managed services: Consider migrating suitable workloads to more cost-effective, managed solutions.
- Implement Infrastructure as Code (IaC): Use IaC for consistent, version-controlled, and optimized deployments.
Example Terraform code for a scalable, cost-optimized architecture:
This example showcases a Terraform configuration for an Auto Scaling Group (ASG) in AWS. The ASG adapts the number of EC2 instances based on demand, ensuring efficient resource use while keeping applications available. It’s also a great example of Infrastructure as Code (IaC), where infrastructure is defined in a clear, reusable way, making deployments consistent and easy to manage.
Pre-requisites:
- Make sure that all referenced resources (
aws_subnet.private.*.id,aws_lb_target_group.web.arn, andaws_launch_template.web.id) that are used in this example are defined elsewhere in your Terraform project. - Verify that the target group's health checks align with your application's requirements.
- Confirm that appropriate IAM permissions are in place to manage autoscaling resources.
resource "aws_autoscaling_group" "web_asg" {
  name                = "web-asg"
  vpc_zone_identifier = aws_subnet.private.*.id
  target_group_arns   = [aws_lb_target_group.web.arn]
  health_check_type   = "ELB"
  min_size            = 2
  max_size            = 10

  launch_template {
    id      = aws_launch_template.web.id
    version = "$Latest"
  }

  tag {
    key                 = "Name"
    value               = "web-server"
    propagate_at_launch = true
  }
}
Key Components of this example:
resource "aws_autoscaling_group" "web_asg"creates an Auto Scaling Group named"web-asg"to automatically scale EC2 instances.- Attributes:
name: Specifies the name of the Auto Scaling Group ("web-asg").vpc_zone_identifier: Points to the private subnets where the instances will be launched. It refers to IDs from theaws_subnet.private.*.idresource.target_group_arns: Links the Auto Scaling Group to an Application Load Balancer (ALB) targetgroup (aws_lb_target_group.web.arn)for load balancing and health checks.health_check_type: Defines the health check type as"ELB"(Elastic Load Balancer), ensuring instances are monitored through the ALB.
- Scaling Configuration:
min_size: Ensures a minimum of 2 instances are always running for availability.max_size: Caps the group at 10 instances to control costs and avoid over-provisioning. - Launch Template: Specifies the configuration for launching EC2 instances.
id: Refers to the ID of the AWS Launch Template (aws_launch_template.web.id), which contains instance details like AMI, instance type, and other parameters.version: Uses the latest version ("$Latest") of the launch template.
- Tag: Automatically applies tags to instances created by the ASG.
- Key-Value Pair:
"Name"tag is set to"web-server". propagate_at_launch: Ensures tags are applied to all instances launched by the ASG.
- Key-Value Pair:
Strategy 10: Leverage Cloud Cost Optimization Tools
Cloud providers and third-party vendors offer a range of tools to streamline cost optimization by providing insights, automating tasks, and recommending cost-saving measures. Interpreting the often detailed and complex cloud bills becomes manageable when businesses focus on high-expenditure areas like compute, storage, and managed services such as databases—key contributors to overall cloud costs.
Most CSPs include cost management tools capable of identifying spending trends, detecting anomalies, and pinpointing cost drivers. Advanced features like machine learning can highlight unusual usage patterns, while heat-mapping tools visualize demand peaks and troughs, guiding decisions on when to scale down resources. Alerts can also be set up to notify businesses when costs or usage exceed predefined thresholds. Additionally, effective tagging strategies allow businesses to categorize expenditures—by department or project—offering a clearer view of ROI and enhancing cost tracking.
Key features to look for in cloud cost optimization tools:
- Multi-cloud support: Ability to manage costs across different cloud providers.
- Detailed cost breakdowns: Granular visibility into spending by service, region, and tag.
- Anomaly detection: Automated identification of unusual spending patterns.
- Optimization recommendations: AI-driven suggestions for cost reduction.
- Budget alerts and forecasting: Proactive notifications and spending projections.
Example: AWS Cost Explorer provides detailed cost breakdowns, usage patterns, and reservation recommendations to help optimize your AWS spending.
Optimizing Cloud Costs with SigNoz
While focusing on direct cloud costs is crucial, it's equally important to consider the impact of application performance on overall efficiency. SigNoz, an open-source application performance monitoring (APM) and observability platform, can play a significant role in indirect cost optimization.
SigNoz helps you:
- Identify resource-intensive services: Pinpoint applications or microservices consuming excessive resources.
- Optimize application performance: Improve efficiency, reducing the need for over-provisioning.
- Troubleshoot issues quickly: Minimize downtime and associated costs.
- Make data-driven scaling decisions: Use performance metrics to inform auto-scaling policies.
By providing deep insights into your application's behaviour, SigNoz enables you to optimize both performance and resource utilization, leading to significant cost savings in your cloud environment.
SigNoz cloud is the easiest way to run SigNoz. Sign up for a free account and get 30 days of unlimited access to all features.
You can also install and self-host SigNoz yourself since it is open-source. With 19,000+ GitHub stars, open-source SigNoz is loved by developers. Find the instructions to self-host SigNoz.
Let’s take a look at a practical demo of how we can optimize cloud costs with SigNoz,
Optimizing Cloud Costs with SigNoz: A Practical Example
Let us give you a brief of what we’re doing here:
- Environment Setup: Before we begin, let's review the basic environment setup we need.
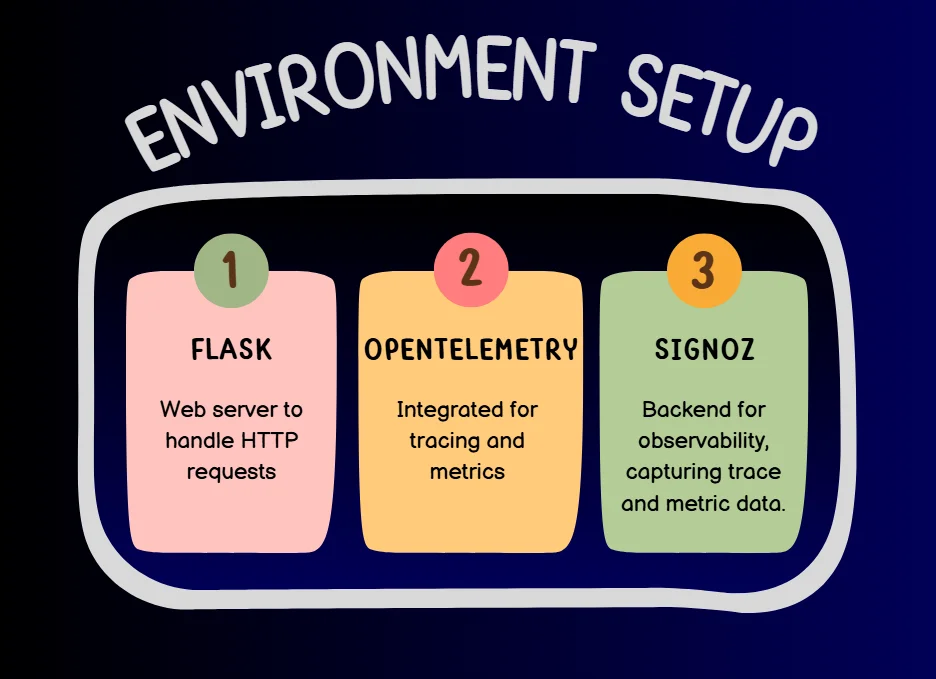
- Observability Components
- Tracer Initialization: A tracer is set up to monitor spans of code execution. The spans are exported to SigNoz for visualization and analysis.
- Metrics Initialization: A custom metric (
http_requests) is created to count HTTP requests per endpoint.
- Operations: The application includes routes to simulate various real-world scenarios like,
- Main operation (
/): Simulates a primary operation with a nested sub-operation. Traces both operations with spans and logs custom events for observability. - Resource-intensive operation (
/resource-intensive): Simulates a computationally heavy task to identify inefficiencies. Captures metrics like execution time and logs milestones. - Latency simulation (
/simulate-latency): Introduces artificial latency (3 seconds) to observe how the application behaves under slow responses. Helps optimize request handling and cost-efficiency under real-world latencies. - Logging demo (
/logging-demo): Demonstrates capturing logs as structured trace events. - External API call (
/fetch-data): Makes an HTTP request to simulate dependencies on third-party services. Tracks request-response times and errors.
- Monitoring Cloud Costs in SigNoz: We observe the following data in SigNoz,
- Latency (
P50,P95,P99): Identifies inefficient processes or high-response times. - Error Rates: Detects operations prone to failure.
- Resource-Intensive Calls: Highlights bottlenecks to optimize compute power and reduce costs.
Pre-requisites
Create a python virtual environment
venvusing the following command:python -m venv venvBy now your current file directory should look like:
cloud_cost/
├── venv/
│   ├── include/
│   ├── lib/
│   ├── scripts/
│   └── pyvenv.cfg
└── app.py
Activate virtual environment using the following command:
.\venv\Scripts\ActivateIf you run into an error while activating the virtual environment change the execution policy for the current user to allow local scripts and scripts signed by a trusted publisher using the following command:
Set-ExecutionPolicy -ExecutionPolicy RemoteSigned -Scope CurrentUserOnce you’ve successfully activated the virtual environment you should see the following as your directory path in the PowerShell terminal:
(venv) PS C:\Users\Desktop\SigNoz\flasklog>Install the required packages
pip install flask opentelemetry-api opentelemetry-sdk opentelemetry-exporter-otlp opentelemetry-instrumentation-logging opentelemetry-instrumentation-requests
Implementation Code
The following code sets up a Flask web application with observability features enabled using OpenTelemetry. The main goal is to track, trace, and log various operations within the application while exporting trace and metric data to SigNoz for monitoring and analysis.
import logging
import time
from flask import Flask, request
from opentelemetry import trace
from opentelemetry.sdk.resources import Resource
from opentelemetry.sdk.trace import TracerProvider
from opentelemetry.sdk.trace.export import BatchSpanProcessor
from opentelemetry.exporter.otlp.proto.grpc.trace_exporter import OTLPSpanExporter
from opentelemetry.metrics import get_meter_provider
from opentelemetry.sdk.metrics import MeterProvider
from opentelemetry.sdk.metrics.export import PeriodicExportingMetricReader
from opentelemetry.exporter.otlp.proto.grpc.metric_exporter import OTLPMetricExporter
from opentelemetry.instrumentation.logging import LoggingInstrumentor
from opentelemetry.instrumentation.requests import RequestsInstrumentor

# Initialize tracer provider with service name
resource = Resource(attributes={"service.name": "my_flask_service"})
trace.set_tracer_provider(TracerProvider(resource=resource))
tracer = trace.get_tracer(__name__)

# Configure OTLP exporter for tracing with SigNoz
span_exporter = OTLPSpanExporter(
    endpoint="https://ingest.in.signoz.cloud:443",
    headers=(("authorization", "Your_Bearer_Token"),)  # Replace with your token
)
span_processor = BatchSpanProcessor(span_exporter)
trace.get_tracer_provider().add_span_processor(span_processor)

# Initialize metrics provider with OTLP exporter
metric_exporter = OTLPMetricExporter(
    endpoint="https://ingest.in.signoz.cloud:443",
    headers=(("authorization", "Your_Bearer_Token"),)  # Replace with your token
)
metric_reader = PeriodicExportingMetricReader(metric_exporter)

# Set the meter provider globally
meter_provider = MeterProvider(metric_readers=[metric_reader])
trace.set_tracer_provider(meter_provider)

meter = get_meter_provider().get_meter("my_flask_service")

# Create custom metric for HTTP requests
request_counter = meter.create_counter(
    name="http_requests",
    description="Count of HTTP requests",
    unit="1",
)

# Instrument requests library for tracing
RequestsInstrumentor().instrument()

# Configure logging
LoggingInstrumentor().instrument(set_logging_format=True)
logging.basicConfig(level=logging.INFO)
logger = logging.getLogger(__name__)

# Flask application setup
app = Flask(__name__)

@app.before_request
def before_request():
    request_counter.add(1, {"endpoint": request.path})

@app.route('/')
def index():
    with tracer.start_as_current_span("main_operation") as main_span:
        # Perform main operation
        with tracer.start_as_current_span("sub_operation") as sub_span:
            # Perform sub-operation
            sub_span.set_attribute("key", "value")
            sub_span.add_event("sub-operation milestone reached")
        main_span.set_status(trace.StatusCode.OK)
        logger.info("Index endpoint accessed.")
    return "Tracing complete!"

@app.route('/resource-intensive')
def resource_intensive():
    with tracer.start_as_current_span("resource_intensive_operation") as span:
        try:
            result = sum([i2 for i in range(106)])  # Simulate heavy computation
            span.set_attribute("operation", "heavy_computation")
            span.add_event("Completed heavy computation")
            logger.info("Resource-intensive operation completed.")
        except Exception as e:
            span.record_exception(e)
            span.set_status(trace.StatusCode.ERROR)
            logger.error(f"Error in resource-intensive operation: {e}")
            return "An error occurred during the resource-intensive operation."
    return f"Resource-intensive operation complete! Result: {result}"

@app.route('/simulate-latency')
def simulate_latency():
    with tracer.start_as_current_span("simulate_latency") as span:
        time.sleep(3)  # Simulate latency
        span.add_event("Simulated latency of 3 seconds")
        logger.info("Simulated latency endpoint accessed.")
    return "Latency simulation complete!"

@app.route('/logging-demo')
def logging_demo():
    with tracer.start_as_current_span("logging_operation") as span:
        logger.info("Starting a logging operation.")
        span.add_event("Log message sent")
    return "Logging operation complete!"

@app.route('/fetch-data')
def fetch_data():
    with tracer.start_as_current_span("fetch_data_from_api") as span:
        try:
            response = requests.get("https://jsonplaceholder.typicode.com/posts/1")
            span.set_attribute("response_status", response.status_code)
            span.add_event("Fetched data from external API")
            logger.info(f"API response status: {response.status_code}")
        except Exception as e:
            span.record_exception(e)
            span.set_status(trace.StatusCode.ERROR)
            logger.error(f"Error in fetch-data operation: {e}")
            return "An error occurred while fetching data."
    return response.json()

if __name__ == "__main__":
    app.run(debug=True)
Key components and functionality:
Tracer and Metrics Setup:
The OpenTelemetry tracer provider and meter provider are configured to enable tracing and metrics collection. These are exported to SigNoz via OTLP exporters. Custom metrics, like the count of HTTP requests, are tracked using a counter.
Instrumentation:
The
requestslibrary is instrumented to trace outgoing HTTP requests, and theloggingmodule is instrumented for enhanced logging capabilities.Flask Routes:
We define several routes such as:
Routes Description /The main endpoint, where tracing occurs on the root operation and a sub-operation. /resource-intensiveSimulates a resource-heavy computation, and its performance is traced. /simulate-latencyIntroduces artificial latency to simulate performance delays and records the trace. /logging-demoDemonstrates logging within a traced operation. /fetch-dataFetches data from an external API and traces the HTTP request. Error Handling and Logging:
Exception handling is implemented for the resource-intensive and fetch-data routes. Errors are recorded in the trace and logged for visibility.
Run the code with the following command:
python app.py
Output:
(venv) PS C:\Users\Desktop\signoz> python app.py
Overriding of current TracerProvider is not allowed
 * Serving Flask app 'app'
 * Debug mode: on
2024-12-21 18:01:18,682 INFO [werkzeug] [_internal.py:97] [trace_id=0 span_id=0 resource.service.name=my_flask_service trace_sampled=False] - WARNING: This is a development server. Do not use it in a production deployment. Use a production WSGI server instead.
 * Running on http://127.0.0.1:5000
2024-12-21 18:01:18,683 INFO [werkzeug] [_internal.py:97] [trace_id=0 span_id=0 resource.service.name=my_flask_service trace_sampled=False] - Press CTRL+C to quit
2024-12-21 18:01:18,684 INFO [werkzeug] [_internal.py:97] [trace_id=0 span_id=0 resource.service.name=my_flask_service trace_sampled=False] -  * Restarting with stat
Overriding of current TracerProvider is not allowed
2024-12-21 18:01:19,395 WARNING [werkzeug] [_internal.py:97] [trace_id=0 span_id=0 resource.service.name=my_flask_service trace_sampled=False] -  * Debugger is active!
2024-12-21 18:01:19,399 INFO [werkzeug] [_internal.py:97] [trace_id=0 span_id=0 resource.service.name=my_flask_service trace_sampled=False] -  * Debugger PIN: 305-448-600
2024-12-21 18:01:40,899 INFO [__main__] [aap2.py:74] [trace_id=16ef65170bcbe22294fb5848a5a08ec4 span_id=328c3e6a05587919 resource.service.name=my_flask_service trace_sampled=True] - Index endpoint accessed.
2024-12-21 18:01:40,900 INFO [werkzeug] [_internal.py:97] [trace_id=0 span_id=0 resource.service.name=my_flask_service trace_sampled=False] - 127.0.0.1 - - [21/Dec/2024 18:01:40] "GET / HTTP/1.1" 200 -
2024-12-21 18:01:47,965 INFO [__main__] [aap2.py:92] [trace_id=1c57641eae8d62cdc2abda1593e7aaa0 span_id=c8bd886374be7694 resource.service.name=my_flask_service trace_sampled=True] - Simulated latency endpoint accessed.
2024-12-21 18:01:47,966 INFO [werkzeug] [_internal.py:97] [trace_id=0 span_id=0 resource.service.name=my_flask_service trace_sampled=False] - 127.0.0.1 - - [21/Dec/2024 18:01:47] "GET /simulate-latency HTTP/1.1" 200 -
2024-12-21 18:02:00,368 INFO [__main__] [aap2.py:84] [trace_id=7dab583b38ecc8c0dde0cecd2c4e9a27 span_id=1a98f3ee2483d09b resource.service.name=my_flask_service trace_sampled=True] - Resource-intensive operation completed.
Access Endpoints to Trigger Operations
After running the code, access the provided endpoints to trigger and observe the root operations. Each endpoint initiates a specific process, allowing you to verify the functionality and performance.
Select
127.0.0.1:5000to initiate the tracing, this is how it will look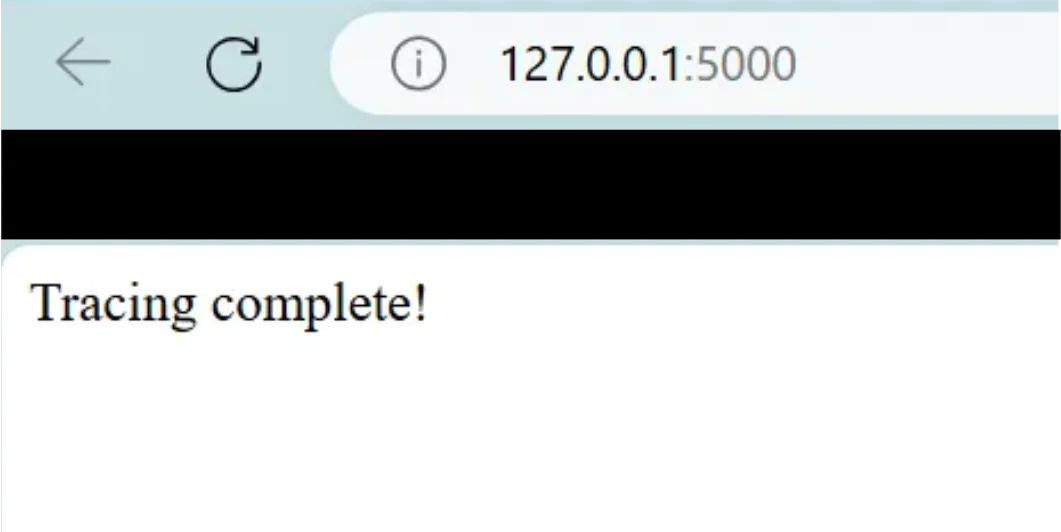
Main Operation Endpoint Select
127.0.0.1:5000/simulate-latencyto initiate the latency simulation,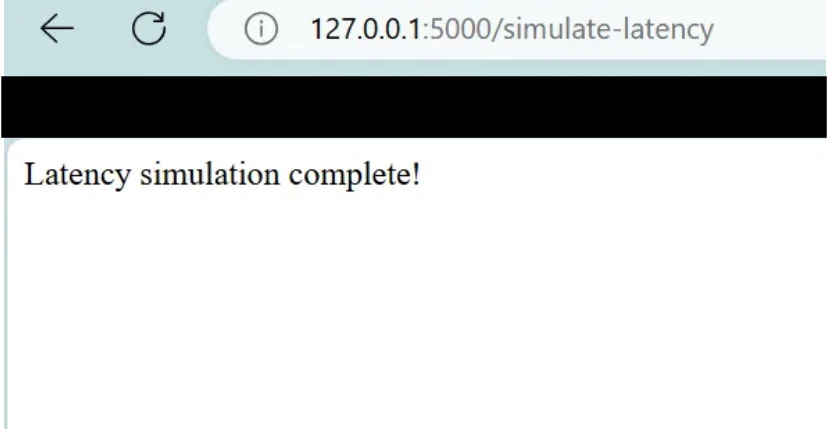
Latency Simulation Endpoint Select
127.0.0.1:5000/resource-intensiveto initiate the resource-intensive operation.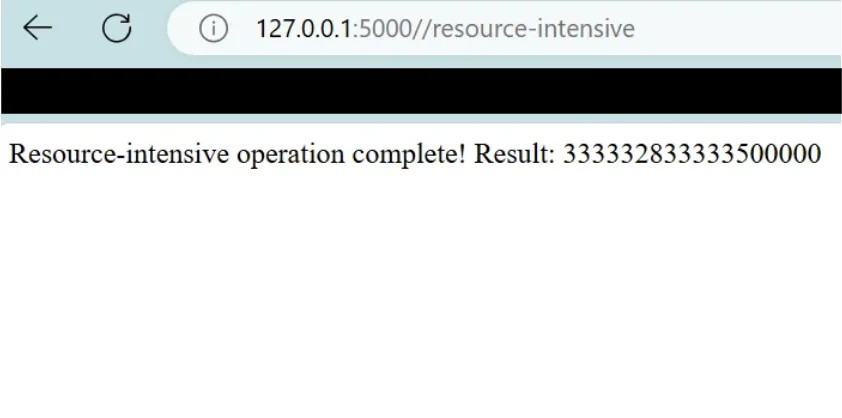
Resource Intensive Endpoint
Monitoring with SigNoz
Migrate to SigNoz, choose "Traces," select your service name (my_flask_service), and set the recent time range to verify if traces have been successfully received from the endpoints.
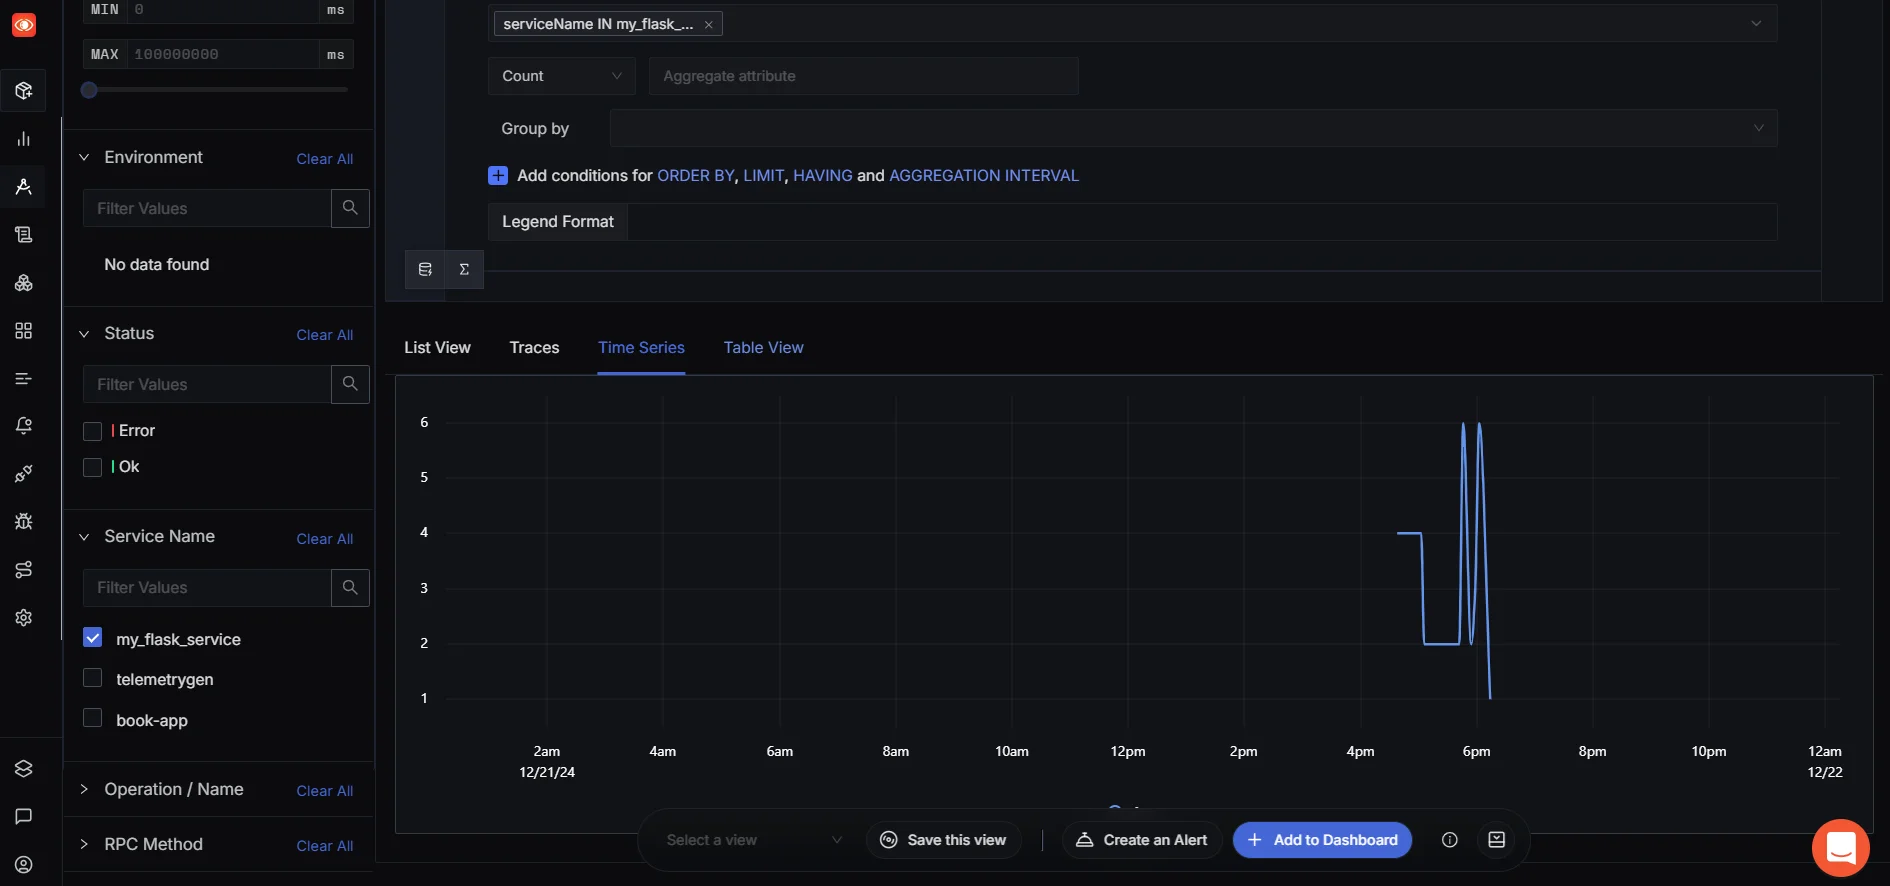
Go to the Traces tab to view the root duration for each root operation.

As you can see, the root duration of both simulate_latency and resource_intensive_operation is greater than that of the main_operation.
Optimizing Cloud Costs
- Optimize Simulate Latency Endpoint
The /simulate-latency endpoint has a duration of 3 seconds (3007.16 ms), which is a potential optimization target.
- Problem: The simulated delay is a constant
time.sleep(3)(3 seconds), which isn't a real workload but an artificial delay. - Solution: The artificial latency can be improved by reducing the
time.sleep()or optimizing the logic for better responsiveness. Instead of having a fixed 3-second delay, consider introducing a random or conditional delay based on external factors or load conditions to make it more dynamic.
@app.route('/simulate-latency')
def simulate_latency():
    with tracer.start_as_current_span("simulate_latency") as span:
        time.sleep(1)  # Simulate latency
        span.add_event("Simulated latency of 1 seconds")
        logger.info("Simulated latency endpoint accessed.")
    return "Latency simulation complete!"
Optimize Resource-Intensive Endpoint
The
/resource-intensiveendpoint has a root duration of 149.51 ms, which seems acceptable, but we can further optimize it.- Problem: The computation in the
resource_intensiveendpoint is an inefficient loop (sum([i2 for i in range(106)])) that takes some time. - Solution: We can optimize the code to perform the computation faster. One approach would be to use NumPy for vectorized operations, which are typically much faster for large datasets.
import numpy as np @app.route('/resource-intensive') def resource_intensive(): with tracer.start_as_current_span("resource_intensive_operation") as span: arr = np.arange(10**6) # Create an array of numbers result = np.sum(arr ** 2) # Vectorized computation (much faster) span.set_attribute("operation", "heavy_computation") span.add_event("Completed heavy computation") [logger.info](http://logger.info/)("Resource-intensive operation completed.") return f"Resource-intensive operation complete! Result: {result}"- Problem: The computation in the
Optimized Results
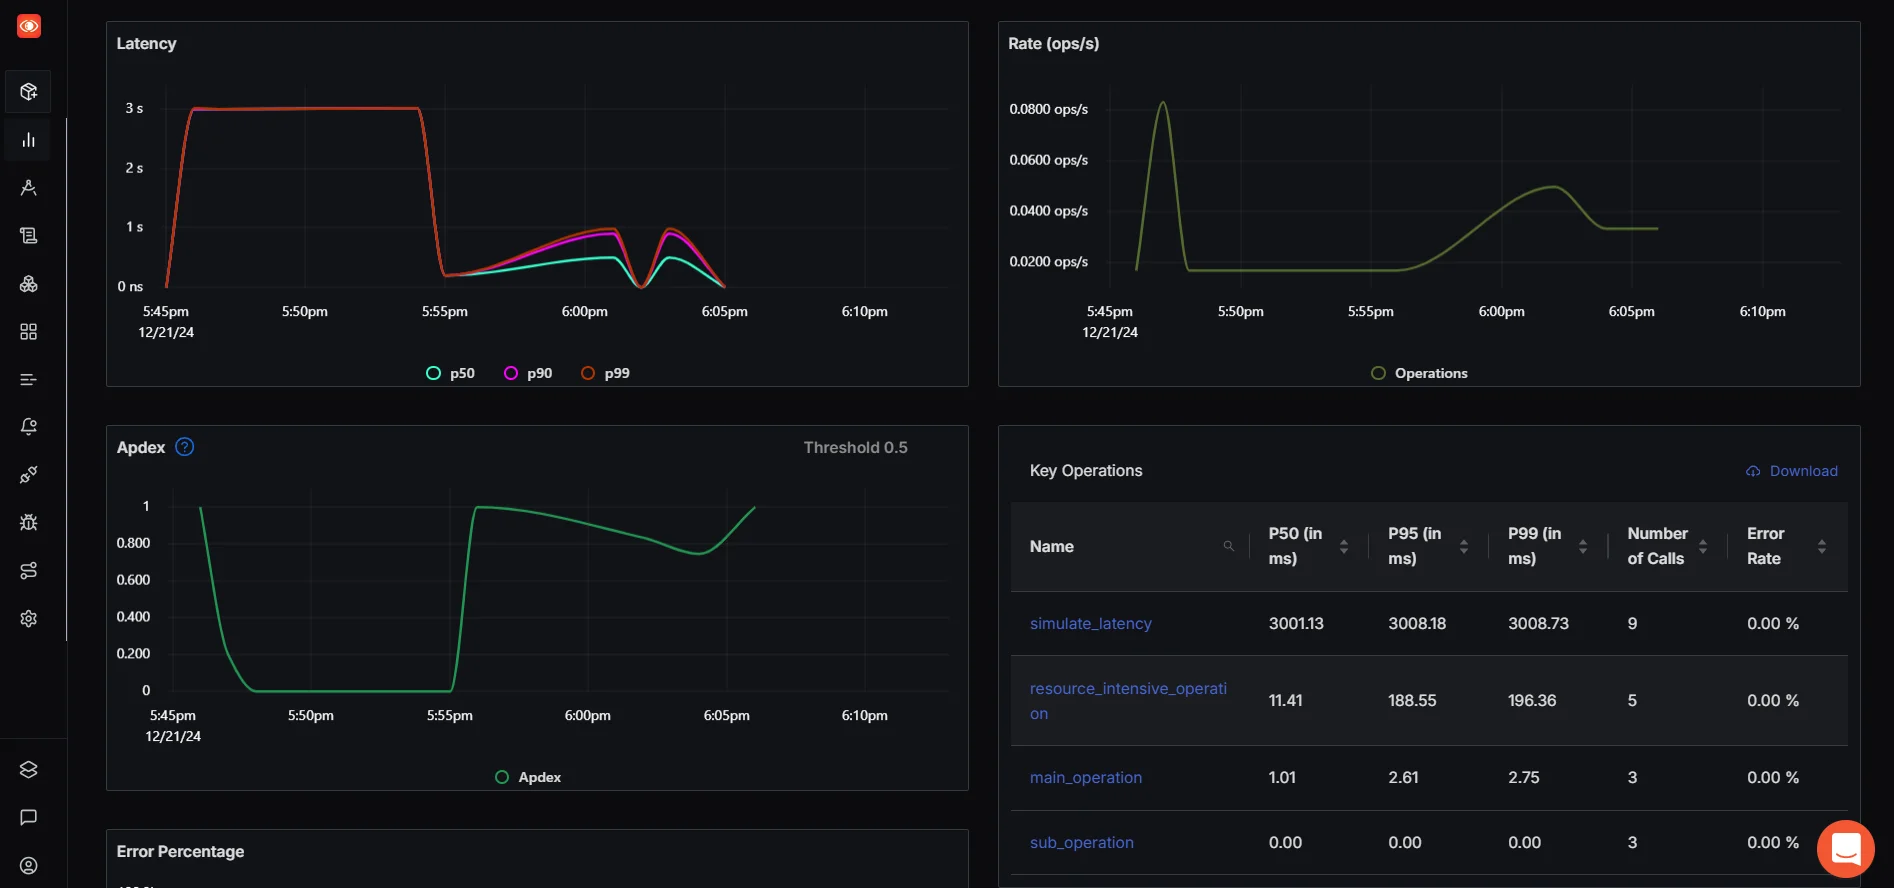
After implementing these changes, re-run the application and trigger the endpoints again to see how the metrics change in SigNoz. Refresh the SigNoz Metrics Dashboard to check how the latency and other metrics improve over time.


Navigate to dashboard metrics in order to see the relative comparison. This dashboard provides an overview of application performance metrics.
Can we optimize more?
/simulate-latency: You can reduce the sleep time from3seconds to a lower value like1second or even0.5second. As you reduce the latency in the code, the corresponding P50, P95, and P99 values in SigNoz should drop, reflecting better performance./resource-intensive: Try reducing the computational complexity of the heavy operation or offload it to a background worker. Alternatively, you could split the task into smaller chunks and process them asynchronously to improve response times.
Challenges in Cost Controlling
Managing cloud costs can often feel like an uphill battle. The very features that make the cloud appealing—like self-service access and virtually unlimited scalability—can quickly become challenges if not properly managed.
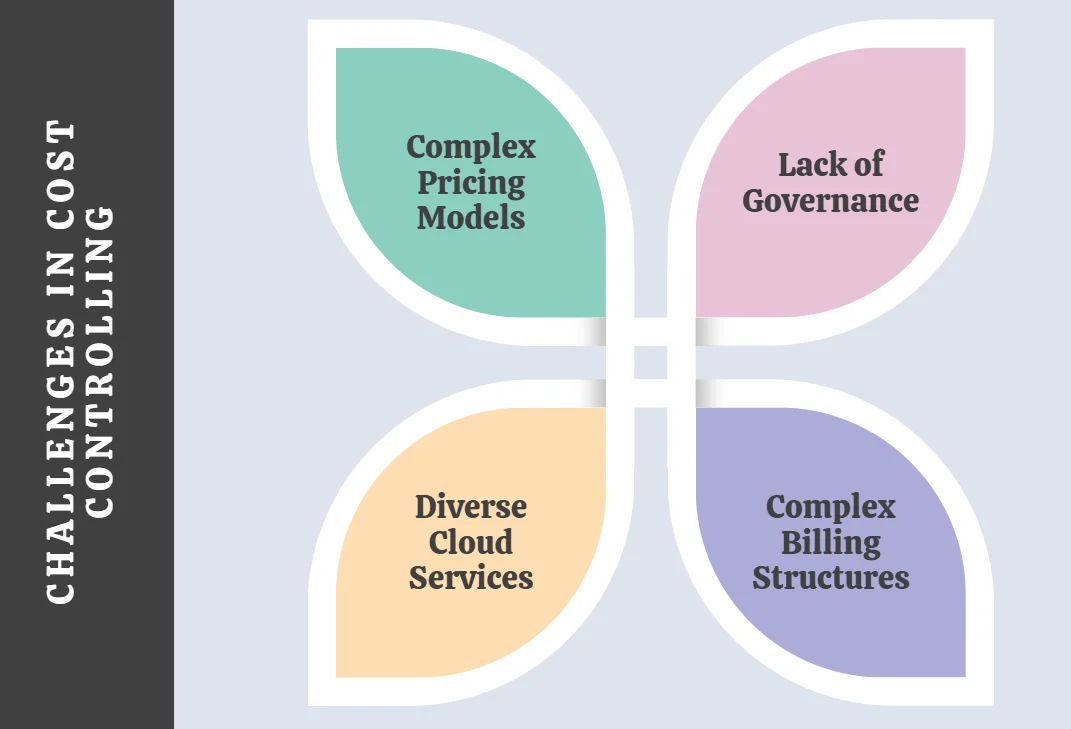
- Complex Pricing Models: The intricacies of cloud pricing are a major contributor to cost management difficulties. SaaS pricing, for instance, typically depends on the number of subscriptions a company holds, requiring constant vigilance to avoid unused licenses. On the other hand, IaaS pricing often hinges on the computing, networking, and storage capacity reserved monthly, adding another layer of complexity.
- Lack of Governance: In decentralized cloud environments, IT teams may independently acquire resources without centralized oversight. While this enables rapid decision-making, unchecked additions can inflate costs. Features like autoscaling offer some control but require well-defined policies, such as clear performance triggers and scaling limits, to prevent overspending.
- Complex Billing Structures: Cloud billing adds to the challenge, with pricing models varying for each configuration option. A typical cloud bill can have hundreds or thousands of line items, and as providers introduce new features and pricing models, the complexity escalates. For companies using multiple providers, differing billing terminologies further complicate matters. Finance teams often lack the expertise to interpret these charges and provide actionable advice to IT teams, hampering optimization efforts.
- Diverse Cloud Services: Relying on multiple cloud services adds another layer of difficulty, as each service has unique pricing and billing structures. This makes consolidating and analyzing costs across providers arduous.
Key Takeaways
- Cloud cost optimization is an ongoing process requiring continuous monitoring and adjustment.
- Implementing a mix of strategies yields the best results for cost reduction.
- Automation and specialized tools play a crucial role in effective cloud cost management.
- Regular review and optimization of cloud architecture is essential for long-term cost efficiency.
- Consider both direct and indirect cost optimization strategies, including application performance monitoring with tools like SigNoz.
FAQs
What is the first step in cloud cost optimization?
The first step in cloud cost optimization is implementing comprehensive cost monitoring. This provides visibility into your current spending patterns and resource utilization, forming the foundation for all other optimization strategies.
How much can businesses save through cloud cost optimization?
Savings from cloud cost optimization can vary widely, but many organizations report reducing their cloud spend by 20-30% through effective optimization strategies. Some businesses have achieved even higher savings, up to 50% or more, particularly when addressing significant inefficiencies.
Are there any risks associated with aggressive cost optimization?
While cost optimization is generally beneficial, overly aggressive measures can lead to performance issues or resource shortages. It's crucial to balance cost-saving efforts with maintaining adequate performance, reliability, and scalability for your applications.
How often should cloud costs be reviewed and optimized?
Cloud costs should be reviewed on an ongoing basis, with detailed analyses performed at least monthly. However, the frequency may vary depending on your organization's size, cloud usage patterns, and rate of change. Automated tools can help with continuous monitoring and optimization.

