As logs become more complex, especially with the rise of microservices and distributed systems, managing and analyzing them efficiently is critical. Loki and Grafana provide an effective log management and visualization solution, and when combined with JSON logs, they offer a powerful way to search, filter, and analyze log data. This guide will walk you through filtering Loki JSON logs in Grafana, from the basics to more advanced techniques.
Understanding Loki JSON Logs and Grafana Integration
Before diving into filtering techniques, it’s essential to understand the foundational concepts of Loki and JSON logs, as well as how Grafana plays a role in visualizing and managing this data.
Loki is a log aggregation system designed to store and query logs, particularly suited for Kubernetes environments. Unlike other logging systems that index the full content of the logs, Loki only indexes metadata like labels, making it more cost-efficient for large-scale log storage.
JSON logs are logs formatted in JavaScript Object Notation (JSON), a lightweight data format that allows for structured log data. JSON logs provide several advantages:
- Human-readable: Logs are easy to read and interpret.
- Structured: Fields can be easily extracted and analyzed.
- Flexible: JSON can support complex data structures like nested objects and arrays.
Here's an example of a JSON log entry that might be ingested by Loki:
{
  "timestamp": "2024-09-25T10:15:30Z",
  "level": "error",
  "message": "Failed to process payment",
  "service": "payment-service",
  "request_id": "abc123",
  "user": {
    "id": "user_98765",
    "email": "[email protected]"
  },
  "transaction": {
    "id": "txn_456789",
    "amount": 100.50,
    "currency": "USD"
  },
  "http": {
    "method": "POST",
    "status_code": 500,
    "path": "/process-payment",
    "client_ip": "192.168.1.1"
  }
}
Grafana is a powerful open-source platform for monitoring and visualizing time-series data, often used in combination with Loki for log analysis.
The combination of Loki's efficient log storage and Grafana's powerful querying capabilities enables you to:
- Quickly search through vast amounts of log data
- Create custom dashboards for log visualization
- Set up alerts based on log patterns or thresholds
- Perform real-time log analysis

How Grafana Detects Fields in JSON Logs
Grafana automatically detects fields in JSON-formatted logs, simplifying the process of filtering and analyzing log data. Here's how it works:
- JSON parsing: Grafana parses the JSON structure of each log entry.
- Field extraction: It identifies key-value pairs within the JSON object.
- Data type inference: Grafana attempts to determine the data type of each field (e.g., string, number, boolean).
- Field mapping: Detected fields are mapped to queryable attributes in Grafana's interface.
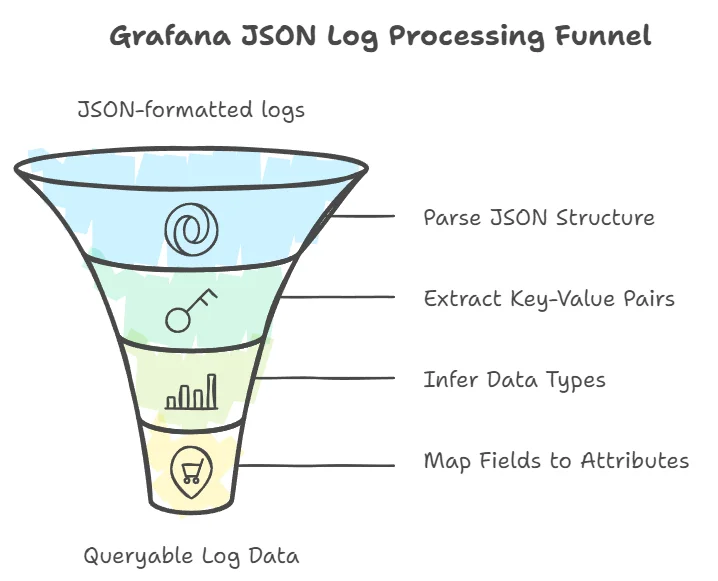
Common types of fields detected in JSON logs include:
- timestamp: When the log event occurred
- level: Log severity (e.g., "info", "error")
- message: The main content or event description
- metadata: Additional contextual information (like the source IP, user ID, etc.)
For Grafana to detect fields effectively, the logs must be well-structured JSON objects. If your JSON logs are inconsistently formatted or contain irregularities, field detection may fail, making it more difficult to filter or search logs accurately.
Limitations in Field Detection
While Grafana does a good job detecting basic fields, there are limitations:
- Nested JSON fields: Complex structures like deeply nested fields or arrays might require more manual effort to parse and filter.
- Inconsistent field names: If logs from different sources use inconsistent field names (e.g., "userID" in one log and "user_id" in another), filtering across logs may become cumbersome.
Step-by-Step Guide to Filtering Loki JSON Logs in Grafana
To begin filtering logs, you need to access the Explore section in Grafana. This is where you can run queries directly against your Loki data source:
In Grafana’s left-hand menu, click on Explore.
Select Loki as your data source from the dropdown menu.
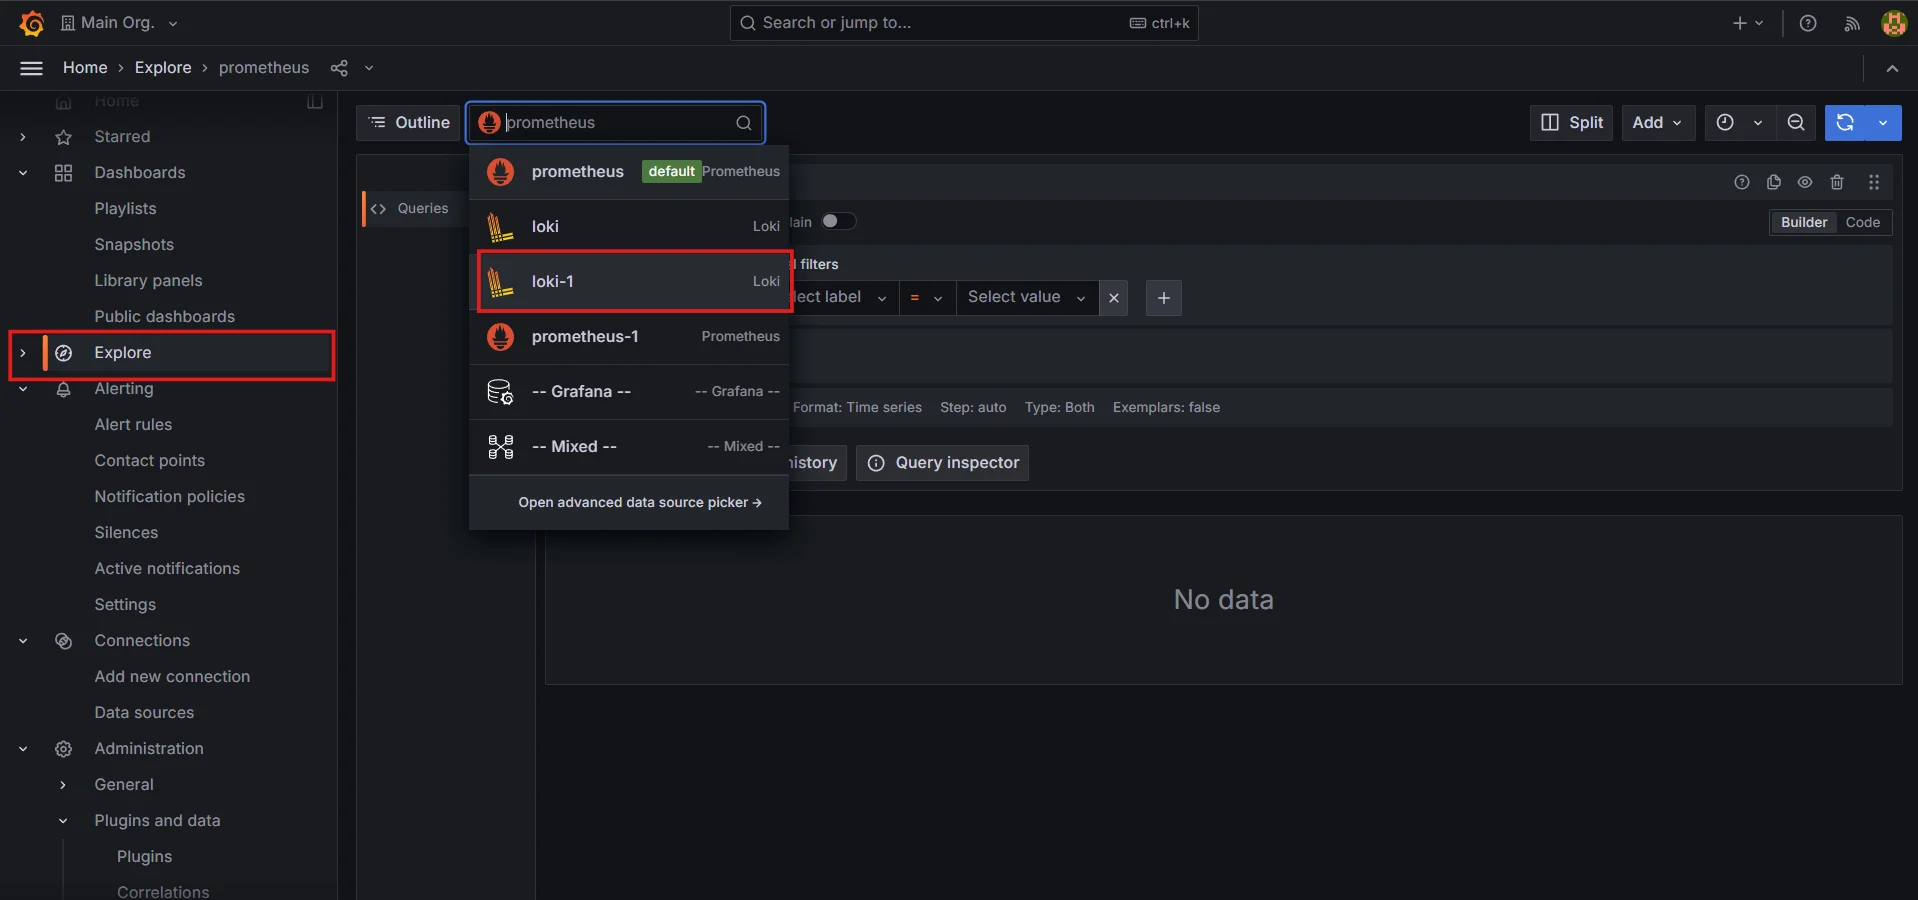
Select Loki as your data source Enter your basic query to retrieve logs (for example,
{job="your-job-name"}).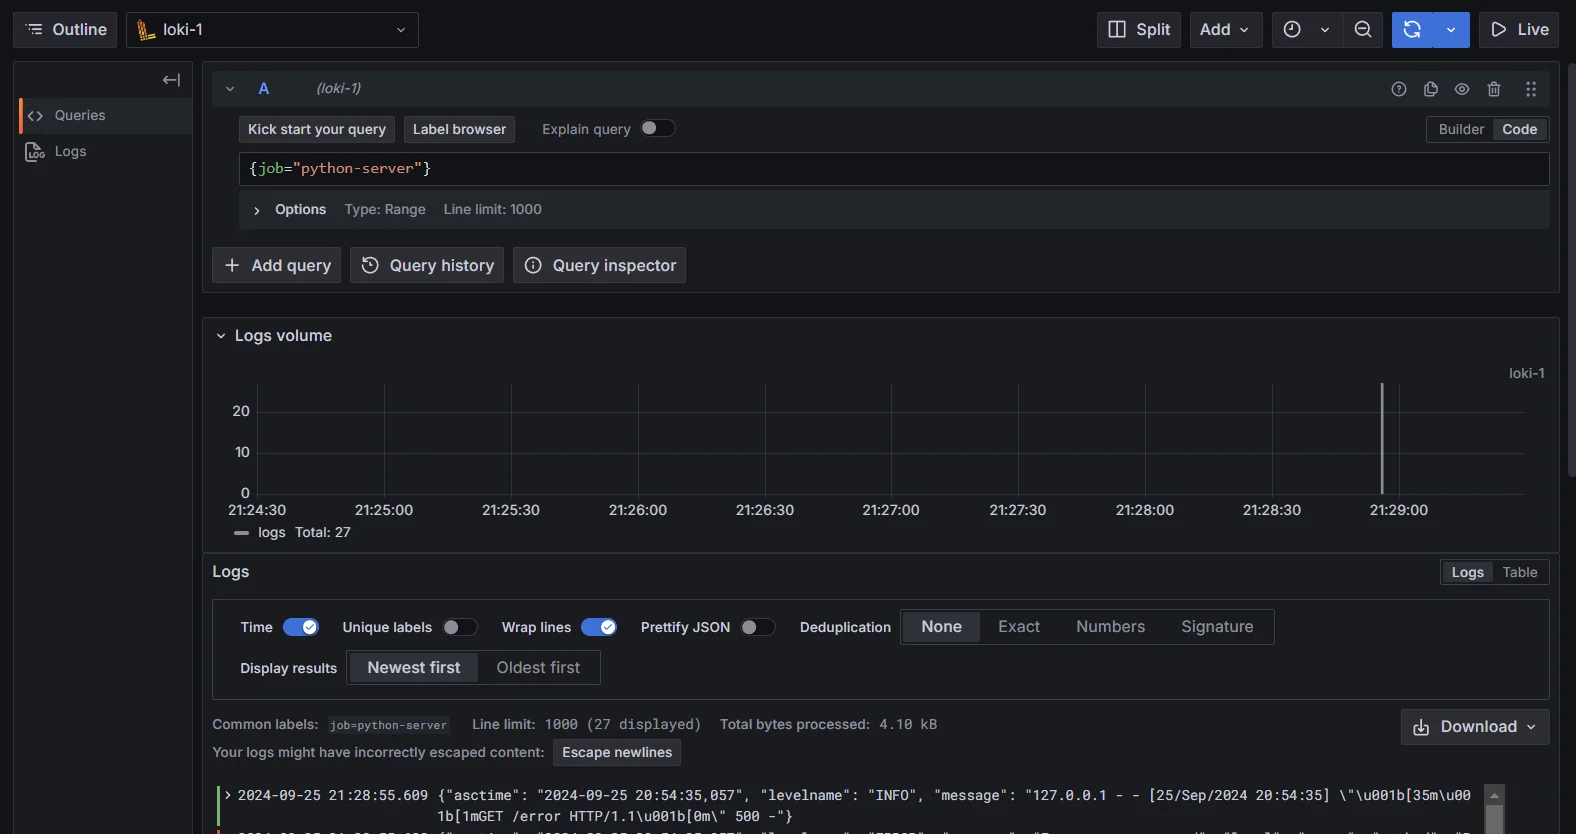
Retrieve logs
Using LogQL for Advanced Filtering
Once you’ve retrieved your logs, you can start using LogQL to filter specific fields from JSON logs.
Extract JSON fields
LogQL includes powerful filtering capabilities for JSON logs. A key operator for parsing JSON fields is the
| jsonoperator, which allows you to extract and filter fields from JSON logs.Example:
{job="python-server"} | jsonThis command extracts all JSON fields from the logs for the selected job.
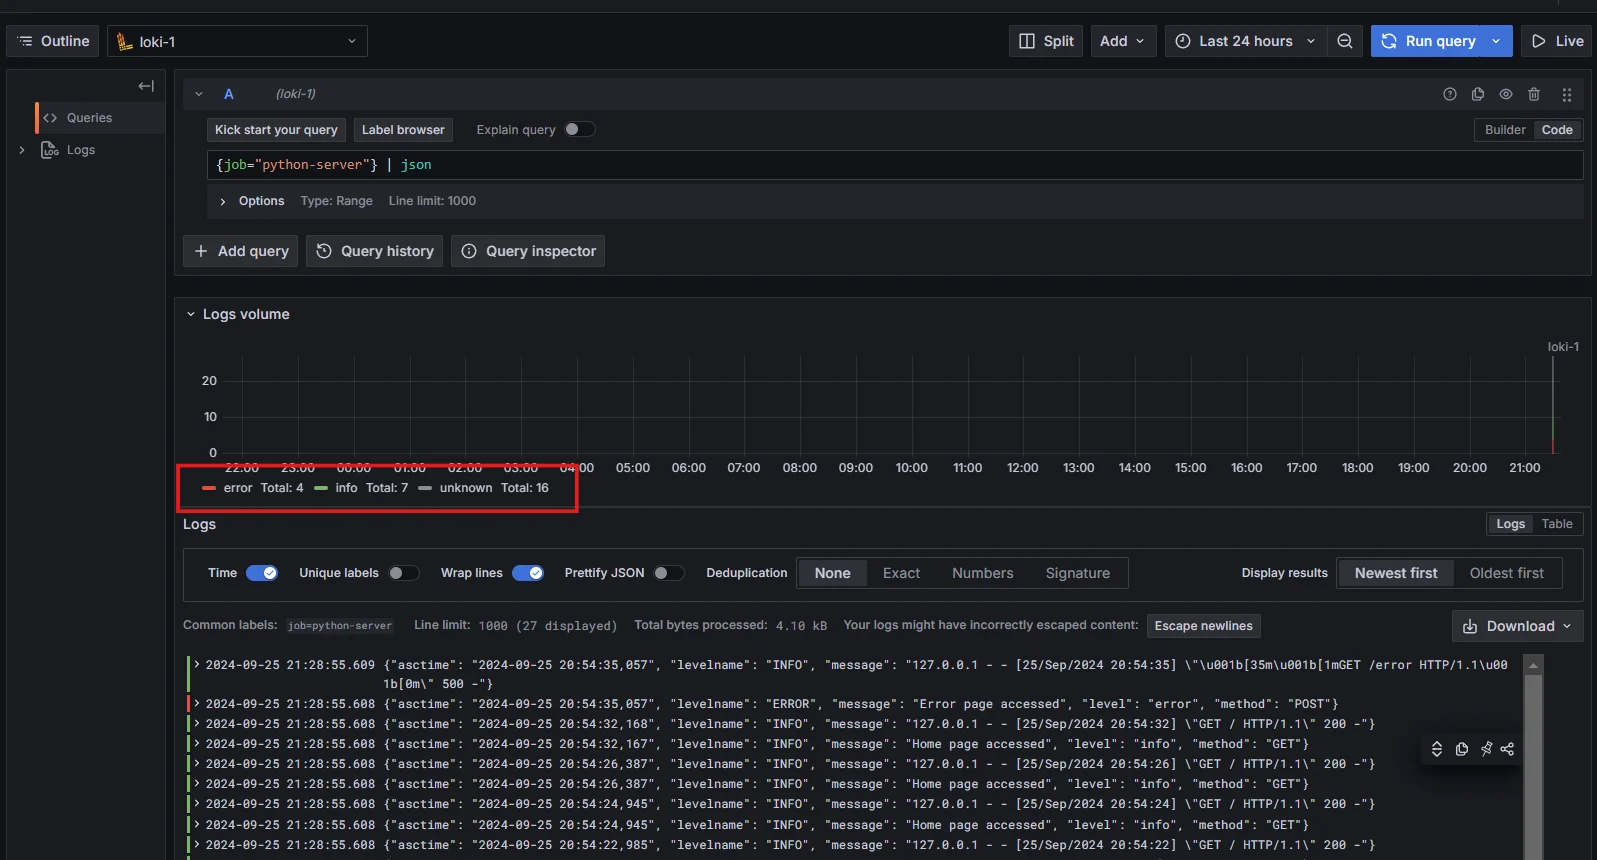
Extract JSON fields using LogQL Extracting Specific Fields
To filter a specific field, you can modify the query as follows:
{job="python-server"} | json | level="error"In this example, the query filters logs with the
job="python-server"label and extracts logs where thelevelfield is set to"error".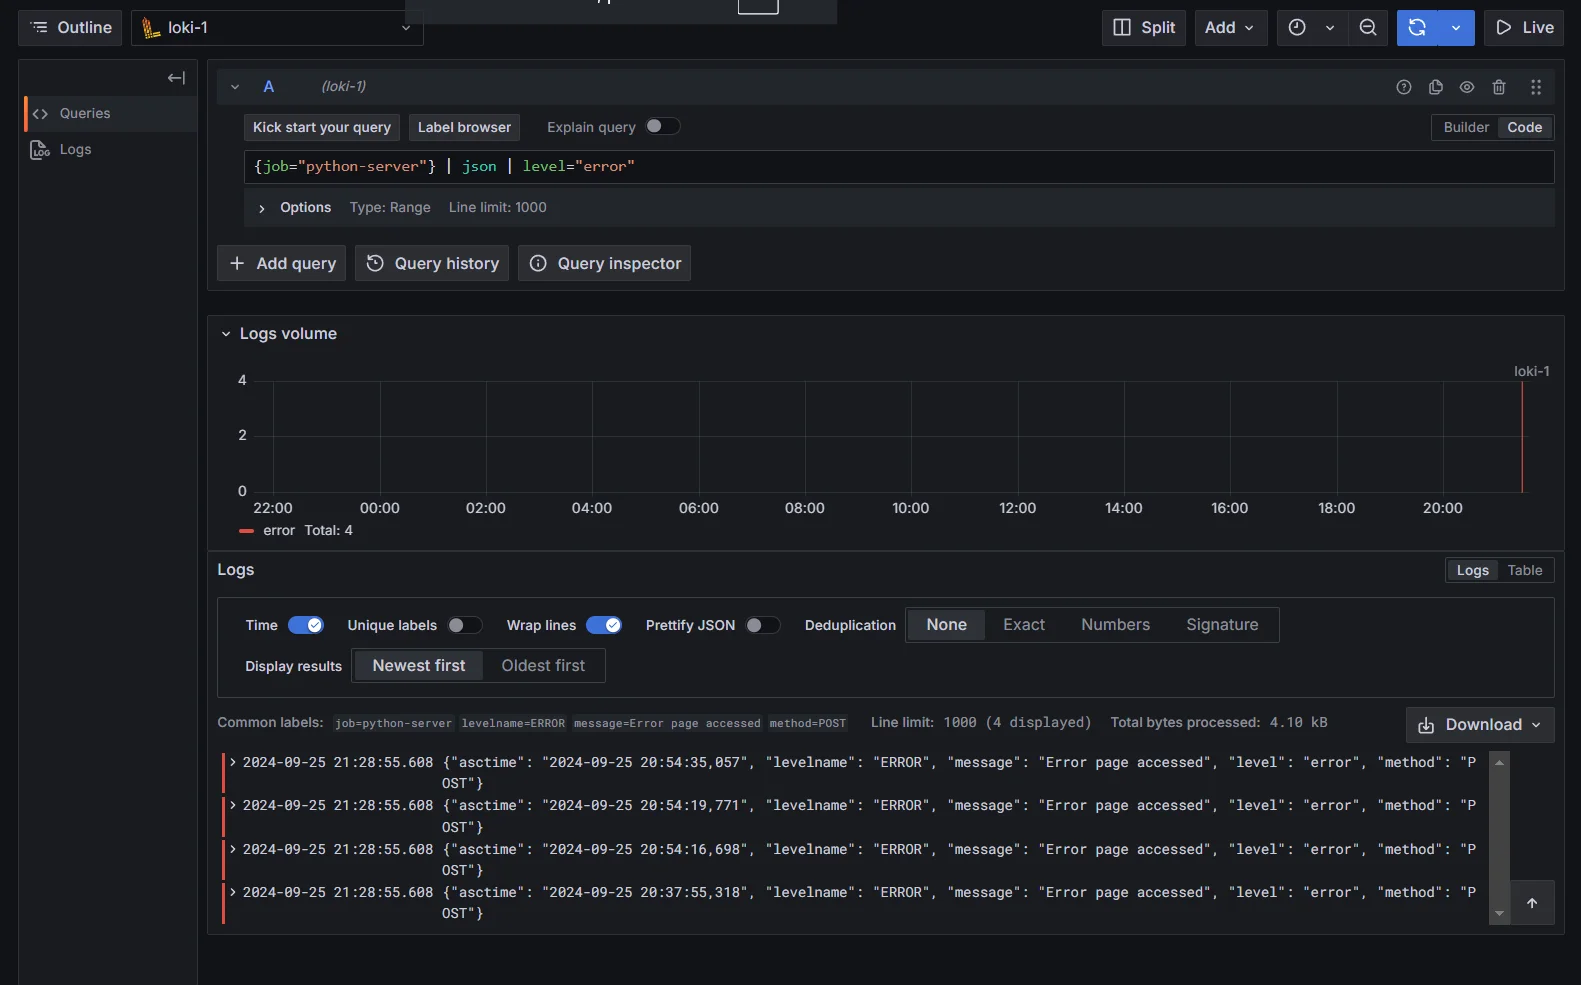
Extract Specific Fields using LogQL Combining Multiple Filters
For more advanced use cases, you can combine multiple filters to narrow down your results:
{job="python-server"} | json | level="error" | method="POST"This query filters for logs where the
levelis"error"and the HTTP method isPOST.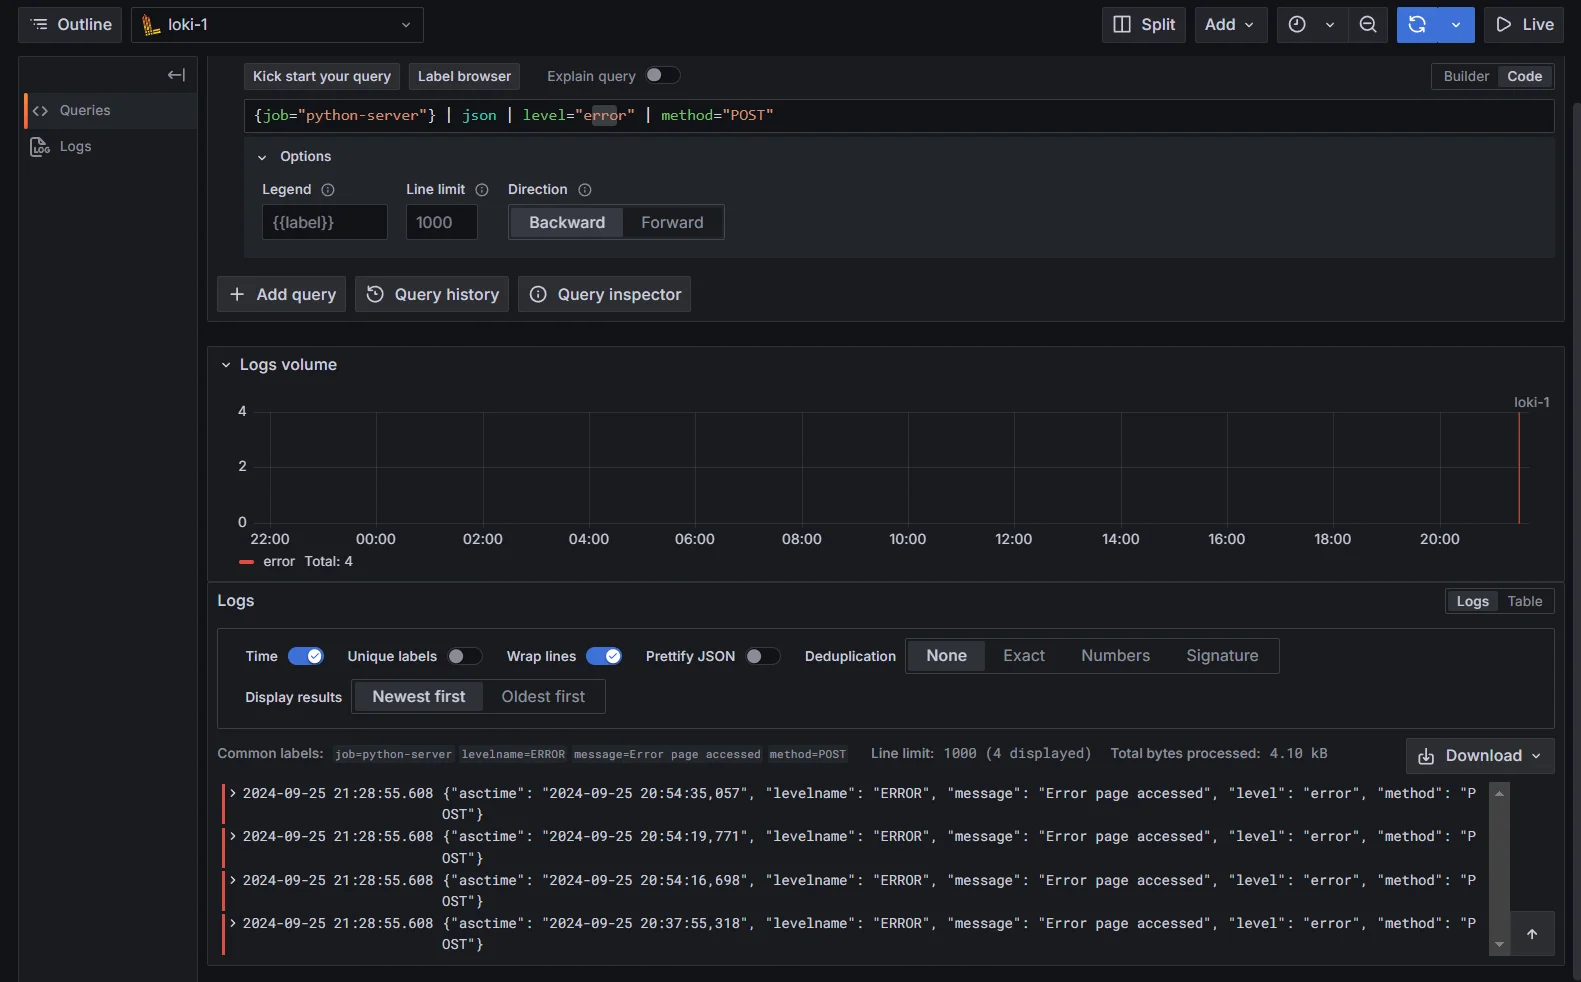
Combining Multiple Filters on JSON fields
Advanced Techniques for JSON Log Filtering
Once you've mastered basic filtering techniques, you can explore more advanced methods to refine your log queries and work with complex structures.
Using Regular Expressions for Flexible Field Matching
Sometimes you may need to filter logs based on patterns in a specific field rather than exact values. In such cases, you can use regular expressions (regex) in LogQL to match fields dynamically.
For example, to filter logs where the
messagefield contains any log related toHomepage, you can use the following query:{job="python-server"} | json | message =~ "Home.*"The
=~operator matches logs where themessagefield follows the given regex pattern, making it a flexible tool for complex log analysis.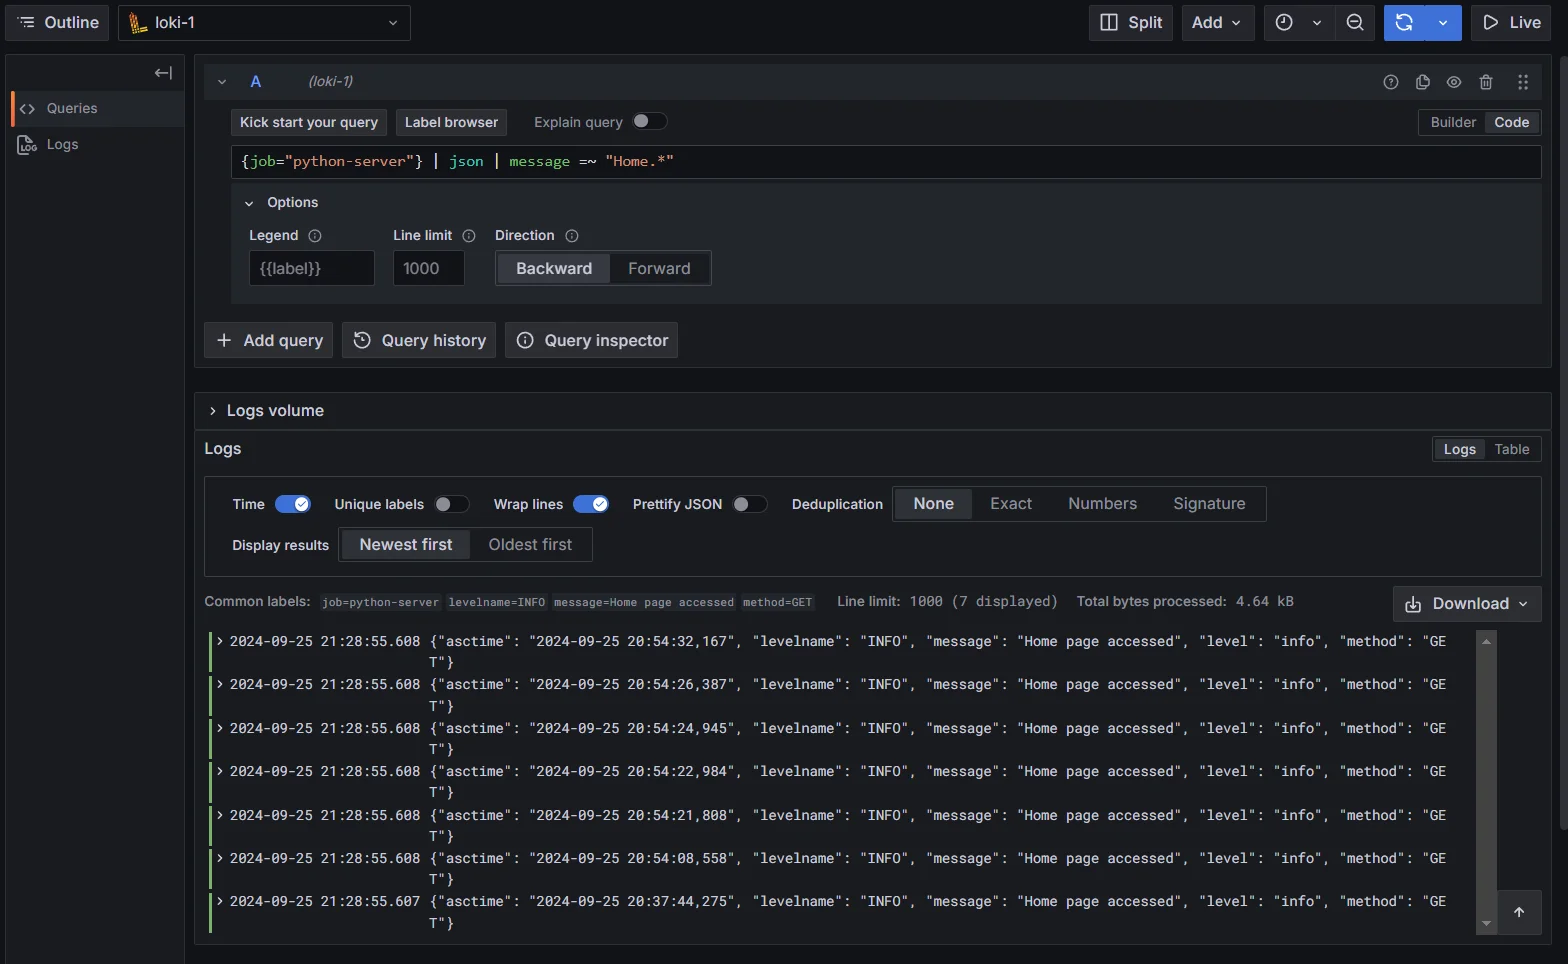
Using Regular Expressions for Flexible Field Matching Implementing Dynamic Field Filtering with Variables
Grafana provides the ability to define variables in dashboards, which can be used dynamically in log queries. This enables you to change the filtering criteria based on user input without modifying the query manually each time.
Check the documentation here to create variables in the Grafana Dashboard
For example, you could create a variable to dynamically filter logs by the
methodfield (e.g.,GET,POST). After creating the variable in your dashboard, you can reference it in your LogQL query like this:{job="python-server"} | json | method="$httpMethod"Here,
$httpMethodis the variable representing the selected HTTP method, allowing users to filter logs interactively via dropdowns or other UI controls.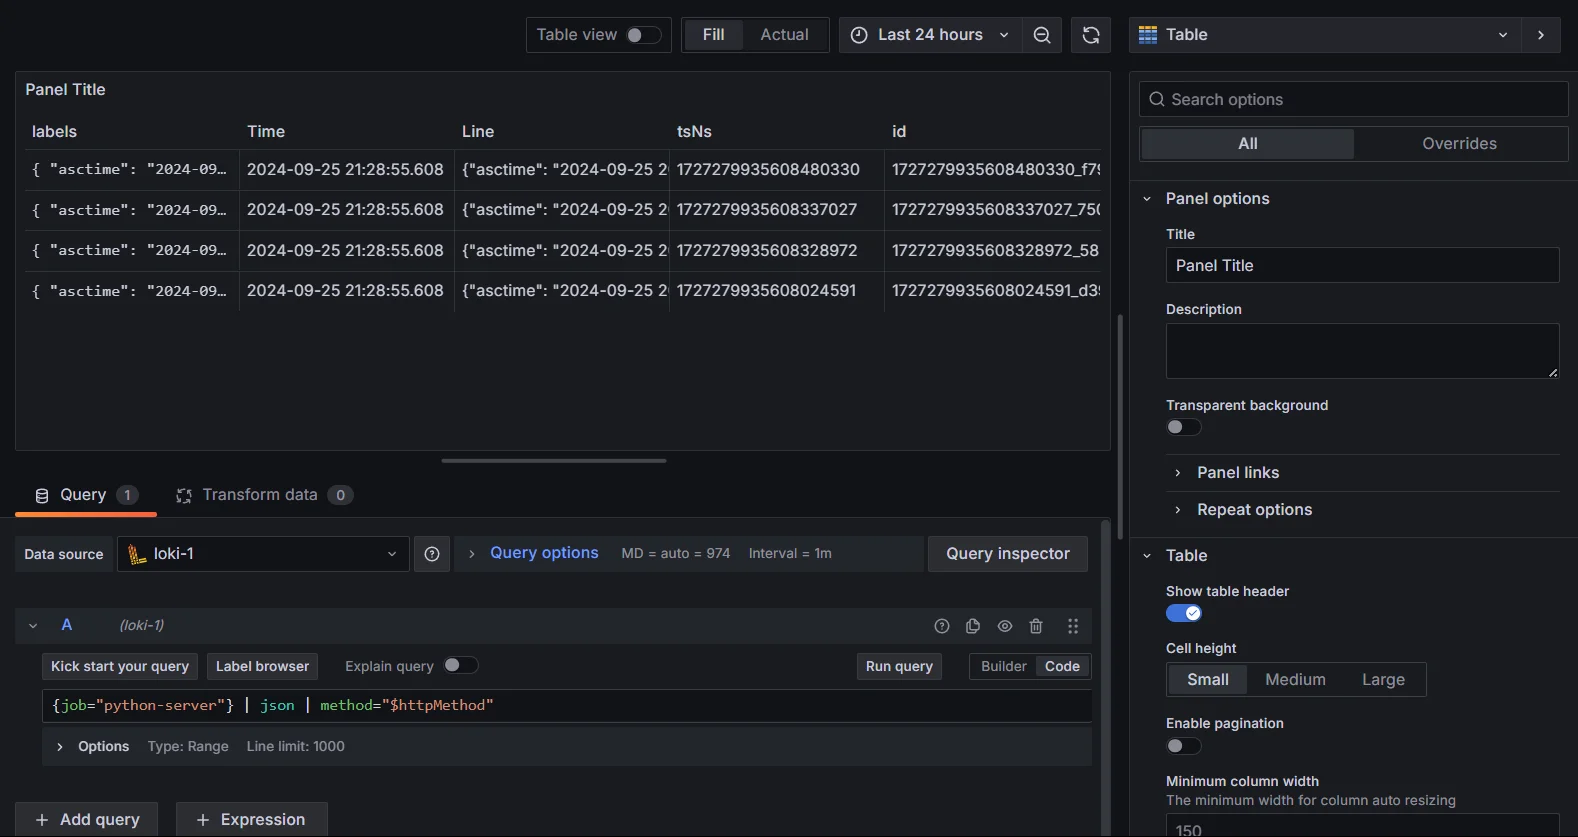
Implementing Dynamic Field Filtering with Variables Leveraging Derived Fields for Enhanced Filtering
Derived fields allow you to enrich your log data by adding new fields based on the content of existing log messages. You can define custom parsing rules in Grafana to extract additional fields from your logs.
For example, you can extract specific fields directly from your JSON logs with a simple query like this:
{job="python-server"}
| json
| line_format "{{ .asctime }} | {{ .levelname }} | {{ .method }} | {{ .message }}"
Output Explanation:
{{ .asctime }}: Displays the timestamp of the log entry.{{ .levelname }}: Displays the log level (INFO, WARNING, etc.).{{ .method }}: Displays the HTTP method (GET, POST, etc.).
Example Log Output:
If you run the above query, you should see an output that looks something like this:
2024-09-25 20:37:44,275 | INFO | GET | Home page accessed ....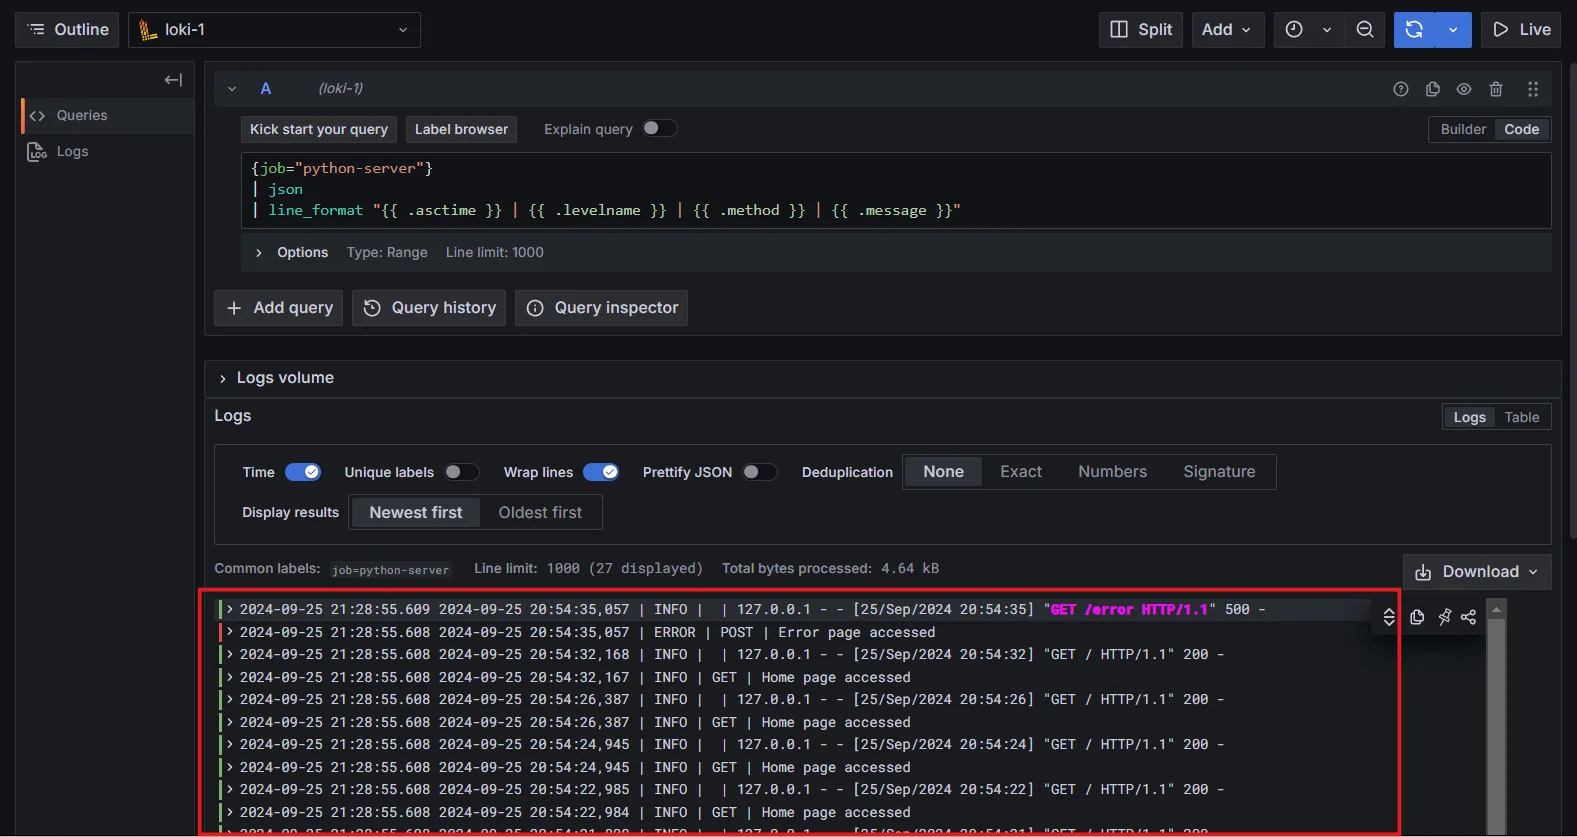
Leveraging Derived Fields for Enhanced Filtering
Best Practices for Efficient JSON Log Filtering in Grafana
Filtering JSON logs can be resource-intensive, especially when dealing with large volumes of logs. To ensure your queries run efficiently, consider the following best practices:
- Use labels for pre-filtering: Start by narrowing down the log stream using labels before applying field filters. This minimizes the amount of data that LogQL has to process.
- Limit time range: Only query logs within a relevant time frame to avoid retrieving unnecessary data.
- Optimize regex patterns: When using regular expressions, try to make them as specific and efficient as possible to reduce processing overhead.
- Index logs efficiently: Ensure that your logs are indexed with appropriate labels, as Loki only indexes labels, not the full log content.
Troubleshooting Common Issues in Loki JSON Log Filtering
When working with JSON logs in Loki and Grafana, you may encounter these common issues:
Inconsistent JSON structures: Ensure all logs follow a consistent JSON format.
Nested JSON objects: Use dot notation to access nested fields:
{app="myapp"} | json | error.code == 500Field detection issues: Verify JSON validity and use explicit parsing when needed:
{app="myapp"} | json field="message"Slow query performance: Optimize queries by using appropriate label filters and time ranges.
Enhancing Log Analysis with SigNoz
While Loki offers powerful log management capabilities, SigNoz takes log analysis a step further with its integrated observability features. Here’s how SigNoz can enhance your log analysis:
- Unified Observability: SigNoz integrates logs, metrics, and traces within a single platform, offering a comprehensive view of application performance.
- Full-Text Search: Unlike Loki, which primarily indexes metadata, SigNoz allows full-text search within logs, enabling faster, more accurate investigations.
- Advanced Filtering & Visualization: SigNoz enhances log filtering options and provides superior visualization tools, making it easier to spot trends and anomalies.
- Trace Integration: SigNoz links logs with traces to improve debugging and performance issue resolution.
- User-Friendly Interface: The intuitive UI of SigNoz simplifies log analysis for users of all levels.
- Open-Source Flexibility: As an open-source platform, SigNoz is highly customizable, allowing users to extend its functionality according to their needs.
SigNoz cloud is the easiest way to run SigNoz. Sign up for a free account and get 30 days of unlimited access to all features.
You can also install and self-host SigNoz yourself since it is open-source. With 19,000+ GitHub stars, open-source SigNoz is loved by developers. Find the instructions to self-host SigNoz.
Key Takeaways
- Loki and Grafana provide a powerful combination for JSON log filtering and analysis.
- Proper JSON structure and field detection are crucial for effective filtering.
- LogQL offers advanced capabilities for extracting and filtering JSON fields.
- Combining multiple filtering techniques allows for complex log queries.
- Regular optimization and troubleshooting ensure efficient log filtering.
- Consider SigNoz for a comprehensive observability solution that includes advanced log management features.
FAQs
How do I filter Loki logs by specific JSON fields in Grafana?
Use the | json operator in LogQL to extract JSON fields, then apply filters:
{app="myapp"} | json | field="value"
Can I use regular expressions to filter JSON fields in Loki logs?
Yes, you can use regex with the =~ operator:
{app="myapp"} | json | message =~ "error.*timeout"
What are the limitations of JSON field detection in Grafana?
Limitations include inconsistent JSON structures, deeply nested objects, and performance issues with large log volumes. Ensure consistent log formatting and use explicit parsing when needed.
How can I improve the performance of JSON log filtering in Loki?
To improve performance:
- Use appropriate label filters to narrow down log streams
- Limit time ranges in your queries
- Avoid parsing large log volumes without necessary filters
- Use indexing and caching strategies in Loki configuration


