Effective incident management is crucial for maintaining system reliability and customer satisfaction in today's fast-paced IT landscape. But how do you measure the success of your incident response efforts? The answer lies in tracking the right incident management metrics. These key performance indicators (KPIs) provide valuable insights into your team's efficiency, response times, and overall incident handling effectiveness.
What Are Incident Management Metrics?
Incident management metrics are quantifiable measures used to evaluate the performance and efficiency of an organization's incident response processes. These metrics help IT teams and managers assess various aspects of incident handling — from detection and response times to resolution rates and customer satisfaction.
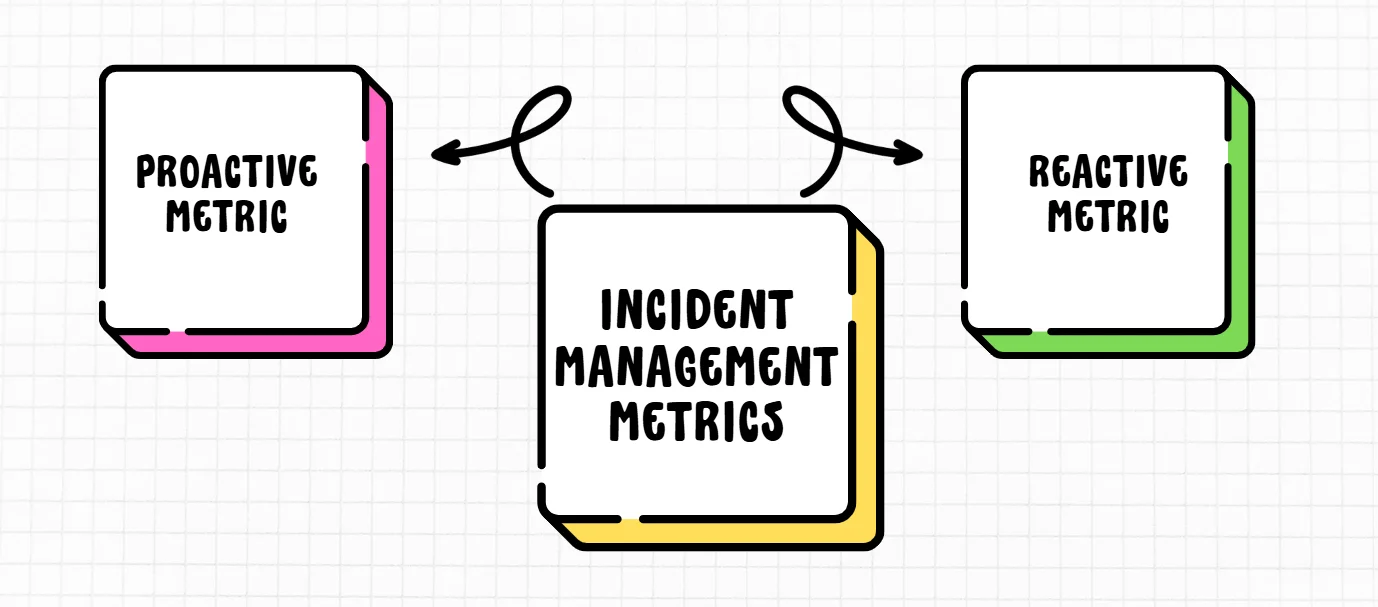
Incident management metrics fall into two main categories:
| Factors | Reactive Metric | Proactive Metric |
|---|---|---|
| Description | Reactive incident response is all about tackling incidents after they’ve already happened, working quickly to get things back to normal and limit any damage. | Proactive incident response is more about staying ahead of the game—anticipating problems and taking steps to stop them before they even start |
| Need | Vital for addressing the immediate consequences of a security breach or system failure. | Crucial for identifying potential risks and implementing measures to prevent security breaches or system failures from happening in the first place. |
| Challenges | Reactive strategies can cause longer downtimes, higher long-term costs, and damage to a company’s reputation, leading to customer churn. Without preparation, teams may struggle to handle incidents efficiently, slowing recovery. | Proactive strategies involve higher upfront costs for tools, skilled personnel, and system monitoring, and can be complex to implement in large IT environments. They may also generate false positives, leading to wasted efforts, and require continuous oversight, which can strain resources. |
| Example | Mean Time to Resolution (MTTR) and First Touch Resolution Rate are examples of reactive metric. | Mean Time Between Failures (MTBF) is a prime example of a proactive metric. |
By tracking a balanced set of both reactive and proactive metrics, you gain a comprehensive view of your incident management performance.
Why Track Incident Management KPIs?
Monitoring incident management metrics offers several benefits:
- Improved response times: By measuring metrics like Mean Time to Acknowledge (MTTA) and Mean Time to Resolution (MTTR), you can identify bottlenecks and streamline your response process.
- Enhanced team performance: Metrics provide objective data to evaluate team performance, set goals, and recognize areas for improvement.
- Better resource allocation: Understanding incident patterns and volumes helps in efficient resource planning and allocation. It can also pinpoint hardware-related incidents requiring replacement or reconfiguration, ensuring smoother operations.
- Boosts performance and customer satisfaction: KPIs set clear benchmarks and goals, driving productivity and system reliability while improving resolution times and first-touch resolution rates, which enhance user satisfaction and build trust.
- Identifies process weaknesses: Tracking KPIs helps uncover bottlenecks in incident resolution. For instance, if simple issues are diagnosed quickly but alert escalation or assignment to the right responders is slow, it highlights improvement areas.
- Reveals issue patterns: Analyzing metrics can uncover correlations between recurring issues linked to factors like configuration, user groups, or service dependencies, enabling a more holistic approach to process optimization.
10 Essential Incident Management Metrics to Monitor
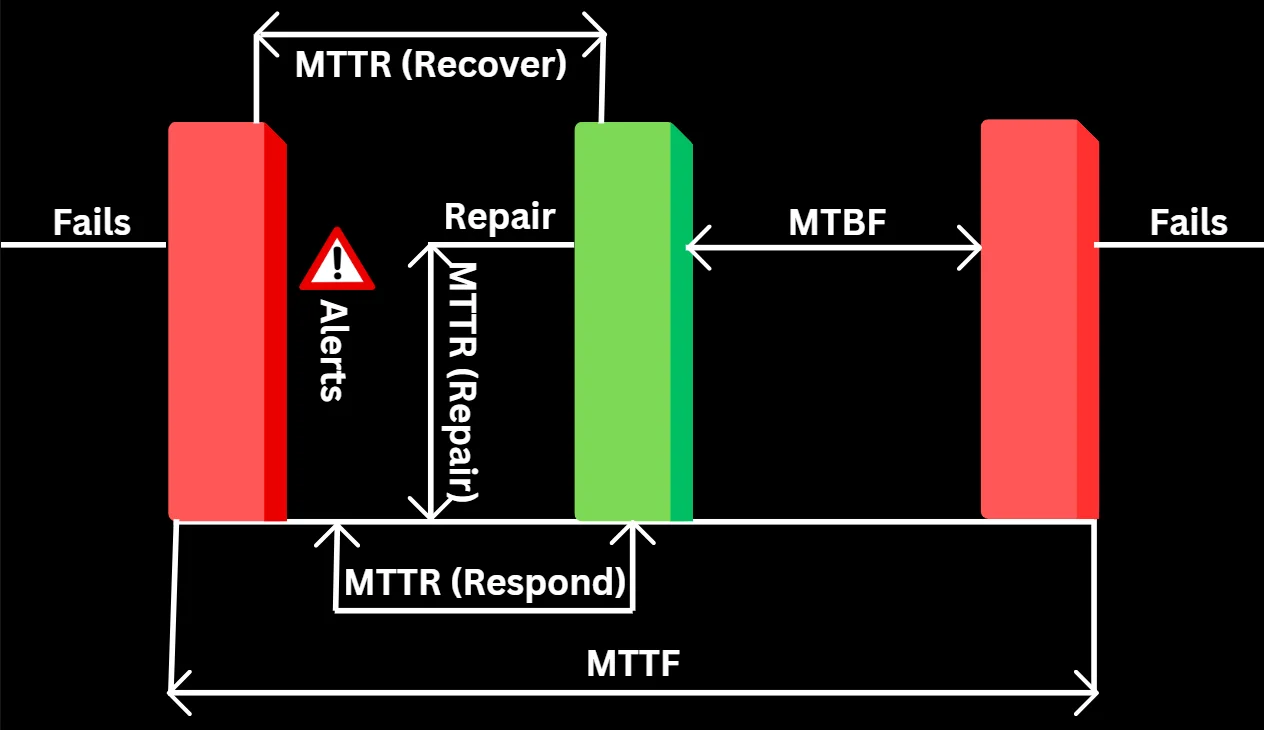
In today’s always-on world, outages and technical incidents have a significant impact, leading to missed deadlines, late payments, and project delays. That’s why it’s crucial for companies to track and measure metrics related to uptime, downtime, and how quickly and effectively teams resolve issues.
1. Mean Time to Detect (MTTD)
MTTD measures the average time between an incident's occurrence and its detection by your monitoring systems or team. This metric is crucial for early incident identification and minimizing potential damage.
To calculate MTTD, use this formula:
MTTD = Total time to detect all incidents / Total number of incidents
Strategies to improve MTTD:
- Implement robust monitoring and alerting systems
- Use AI-powered anomaly detection tools
- Conduct regular system health checks
2. Mean Time to Acknowledge (MTTA)
MTTA measures the average time it takes for your team to acknowledge an incident after it’s detected. It reflects how quickly your team responds and begins addressing the issue.
In other words, MTTA (Mean Time to Acknowledge) tracks the time from when an alert is triggered to when work begins on resolving the incident. This metric is crucial for assessing both your team’s responsiveness and the effectiveness of your alerting system.
Calculate MTTA using:
MTTA = Total time to acknowledge all incidents / Total number of incidents
For instance, if 10 incidents occurred with a total of 40 minutes between alert and acknowledgment, dividing 40 by 10 gives an average MTTA of four minutes.
To reduce MTTA:
- Implement an efficient on-call rotation system
- Use automated alerting tools with escalation policies
- Provide clear incident prioritization guidelines
3. Mean Time to Respond/Resolve/Repair/Recover (MTTR)
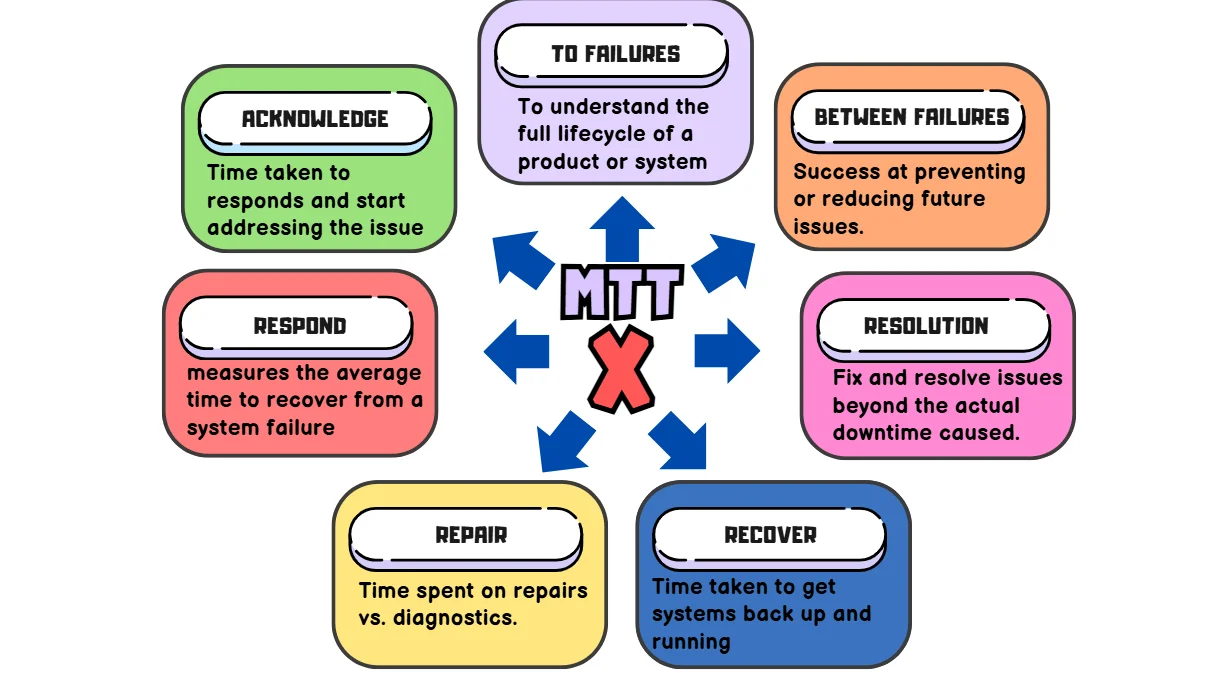
MTTR represents four different measurements—repair, recovery, respond, or resolve. While these metrics overlap, each has its own distinct meaning. So, when discussing MTTR, it's important to clarify which one you're referring to and ensure everyone on the team is aligned on the definition before tracking successes and failures
| Factors | Repair | Respond | Resolve | Recover |
|---|---|---|---|---|
| Description | MTTR (Mean Time to Repair) measures the average time to fix a system, including repair and testing, until it's fully operational. | MTTR (Mean Time to Respond) measures the average time to recover from a system failure, starting from issue detection and excluding alert system delays. | MTTR (Mean Time to Resolve) measures the average time to fully resolve a failure, including detection, diagnosis, repair, and prevention steps. It focuses on long-term improvement, like not just putting out a fire but also fireproofing your house. | MTTR (Mean Time to Recovery or Mean Time to Restore) is the average time taken to recover from a system failure, covering the entire outage duration from the failure occurrence to full system restoration. |
| Formula | Total Repair Time / Number of Repairs | Total Response Time (from alert to recovery) / Number of Incidents | Total Resolution Time / Number of Incidents | Total Downtime / Number of Incidents |
| Challenges | MTTR tracks how quickly repairs are made but doesn't account for delays in issue detection or alerting, which are also important for evaluating incident management. | MTTR for response measures how quickly teams act after being alerted but doesn't account for delays in alerting or detecting the issue, which can significantly impact overall recovery time. | MTTR for resolve focuses on the time taken to fully address and prevent recurrence of an issue but overlooks the efficiency of initial responses or delays in detection that might prolong the overall resolution process. | MTTR gauges recovery speed and helps spot potential issues, but pinpointing root causes like alert failures or slow responses requires deeper analysis. It's a starting point for improving the recovery process. |
| Examples | With 8 outages and 40 hours spent on repairs in a month, we convert 40 hours to 2400 minutes. Dividing 2400 by 8 gives a mean time to repair of 300 minutes. | If there were four incidents in a 40-hour workweek with a total response time of 1 hour, dividing 60 minutes by 4 results in an MTTR of 15 minutes for the week. | Assume that your systems were down for two hours, and the team spent another two hours preventing future outages, the total resolution time would be four hours, resulting in an MTTR of four hours. | Say our systems were down for 30 minutes across two incidents in a 24-hour period, dividing 30 by 2 gives an MTTR of 15 minutes. |
| Criteria | Support and maintenance teams rely on this to ensure repairs stay on schedule. | Utilized in cybersecurity to evaluate a team's effectiveness in countering system attacks. | Used to refer to unplanned incidents, as opposed to service requests, which are usually planned. | Used for evaluating the efficiency of your overall recovery process. |
To improve MTTR:
- Develop and maintain comprehensive incident response playbooks
- Implement post-incident reviews to identify areas for improvement
- Invest in team training and knowledge sharing
4. Incident Volume and Frequency
Tracking the total number of incidents over time helps identify patterns, trends, and potential systemic issues. This metric is essential for capacity planning and resource allocation.
To analyze incident volume:
- Track incidents by type, severity, and affected systems
- Identify peak incident periods and potential correlations with system changes or external factors
- Use trend analysis to predict future incident volumes and plan accordingly
Example: Consider the following mock data for an organization whose incident volume over a 4-week period looks like the following:
| Week | Incident Type | Severity | Affected System | Number of Incidents |
|---|---|---|---|---|
| Week 1 | System Crash | High | Database | 5 |
| Week 1 | Service Outage | Medium | API Gateway | 3 |
| Week 2 | System Crash | High | Database | 7 |
| Week 2 | Service Outage | Low | Web Server | 2 |
| Week 3 | Security Breach | High | Database | 4 |
| Week 3 | Service Outage | Medium | API Gateway | 6 |
| Week 4 | System Crash | Low | Web Server | 1 |
| Week 4 | Service Outage | Medium | API Gateway | 5 |
To analyze incident volume, we track incidents by type, severity, and affected systems. For instance, in Week 1, 5 high-severity database incidents suggest a recurring issue, while Week 3 saw an increase in medium-severity incidents with the API Gateway, pointing to potential performance issues. Peak periods are identified, like Week 2, which had 7 system crashes and 2 service outages, likely linked to a system update.
Trend analysis reveals a consistent pattern of high-severity database incidents, which allows us to predict around 6 similar incidents in Week 5, along with medium and low-severity incidents involving the API Gateway and web server. By applying techniques such as linear regression or moving averages, we can fine-tune these predictions to improve resource planning and take proactive measures.
5. First Touch Resolution Rate
First Touch Resolution Rate measures the percentage of incidents resolved by the first responding team member without escalation or reassignment. This metric indicates your team's efficiency and knowledge base effectiveness.
Calculate First Touch Resolution Rate using:
First Touch Resolution Rate = (Incidents resolved on first touch / Total incidents) x 100
This metric highlights the effectiveness of your incident management system over time. A high first-touch resolution rate indicates a well-optimized and mature system.
To improve this metric:
- Enhance your knowledge base and documentation
- Provide comprehensive training to front-line support staff
- Implement AI-powered chatbots for common issues
6. Escalation Rate
Escalation Rate tracks the percentage of incidents that require escalation to higher-level support tiers. A high escalation rate may indicate gaps in front-line support knowledge or complex underlying issues.
Calculate Escalation Rate with:
Escalation Rate = (Number of escalated incidents / Total number of incidents) x 100
A high escalation rate could indicate skill gaps among team members or inefficiencies in workflows.
To optimize your escalation process:
- Analyze common escalation reasons and address knowledge gaps
- Implement clear escalation policies and guidelines
- Regularly review and refine your tiered support structure
7. Service Level Agreement (SLA) Compliance
An SLA (Service Level Agreement) is a contract between a provider and a client that defines measurable metrics such as uptime, responsiveness, and responsibilities. Tracking these metrics is essential for incident management teams, as SLAs often include commitments like uptime and mean time to recovery. Fluctuations in metrics like average response time or mean time between failures may necessitate quick updates to the agreement or prompt action to address issues. SLA Compliance measures how effectively your team meets the agreed service levels for incident response and resolution, which is vital for maintaining customer trust and fulfilling contractual obligations.
To track SLA Compliance:
- Define clear SLAs for different incident priorities
- Implement automated SLA tracking and alerting
- Regularly review and adjust SLAs based on performance and customer feedback
8. Customer Satisfaction Score (CSAT)
CSAT provides direct feedback on how well your incident management process meets customer expectations. This metric helps identify areas for improvement from the end-user perspective.
To measure CSAT:
- Implement post-incident surveys: It’s recommended to send short surveys immediately after incidents to capture customer satisfaction while the experience is fresh.
- Use Net Promoter Score (NPS) for broader satisfaction measurement: NPS is a metric that gauges customer loyalty by asking how likely they are to recommend your service on a scale of 0-10.
- Analyze customer feedback comments for qualitative insights: Dive into open-ended responses to uncover specific pain points and suggestions
9. Mean Time Between Failures (MTBF)
MTBF (Mean Time Between Failures) measures the average time between repairable failures of a technology product, indicating its reliability and availability. A higher MTBF suggests a more reliable system. Companies typically aim to maximize MTBF, often striving for hundreds of thousands or even millions of hours between failures. As a proactive metric, MTBF evaluates the time between system failures or critical incidents, helping to assess overall system reliability and the effectiveness of preventive measures.
Calculate MTBF using:
MTBF = Total operational time / Number of failures
As a reliability metric, focuses on unplanned outages and unexpected issues, excluding planned downtime for scheduled maintenance. It measures failures in systems that can be repaired, while MTTF (Mean Time to Failure) applies to systems or components that require full replacement. For example, in the case of a refrigerator, the time between repairs for the compressor would be considered MTBF, as the compressor is repairable. However, the overall lifespan of the refrigerator before it needs replacement would be measured as MTTF.
To improve MTBF:
- Conduct regular system maintenance and updates
- Implement redundancy and failover mechanisms
- Use predictive analytics to identify potential failure points
10. Incident Cost
Tracking the financial impact of incidents helps prioritize improvement initiatives and demonstrate the ROI of your incident management efforts. Consider both direct costs (e.g., lost revenue, compensation) and indirect costs (e.g., reputation damage, lost productivity).
To calculate the incident cost:
- Develop a standardized cost model for different incident types such as for system downtime in a particular organization, we can calculate the cost using a model that factors in lost revenue per hour, employee time spent on resolution, and SLA violation penalties.
- Track time spent by personnel on incident resolution
- Consider long-term impacts on customer retention and acquisition
How to Implement Effective Incident Management Metrics
To successfully implement these metrics in your organization:
- Select the right metrics: Choose KPIs that align with your business goals and incident management maturity level.
- Set up data collection: Implement tools and processes to accurately capture metric data.
- Establish baselines: Determine your current performance levels for each metric.
- Set realistic targets: Define improvement goals based on industry benchmarks and your baseline performance.
- Regular review: Analyze metric performance weekly or monthly to identify trends and areas for improvement.
Leveraging SigNoz for Comprehensive Incident Management Tracking
SigNoz is an open-source application performance monitoring (APM) and observability platform that simplifies incident management metric tracking. With SigNoz, you can:
Set up custom alerts based on your defined thresholds
By setting up custom alerts and defining thresholds for a particular metric, we can proactively monitor system performance and receive timely notifications when metrics exceed or fall below defined limits.
Step 1: Set up an alert channel in SigNoz
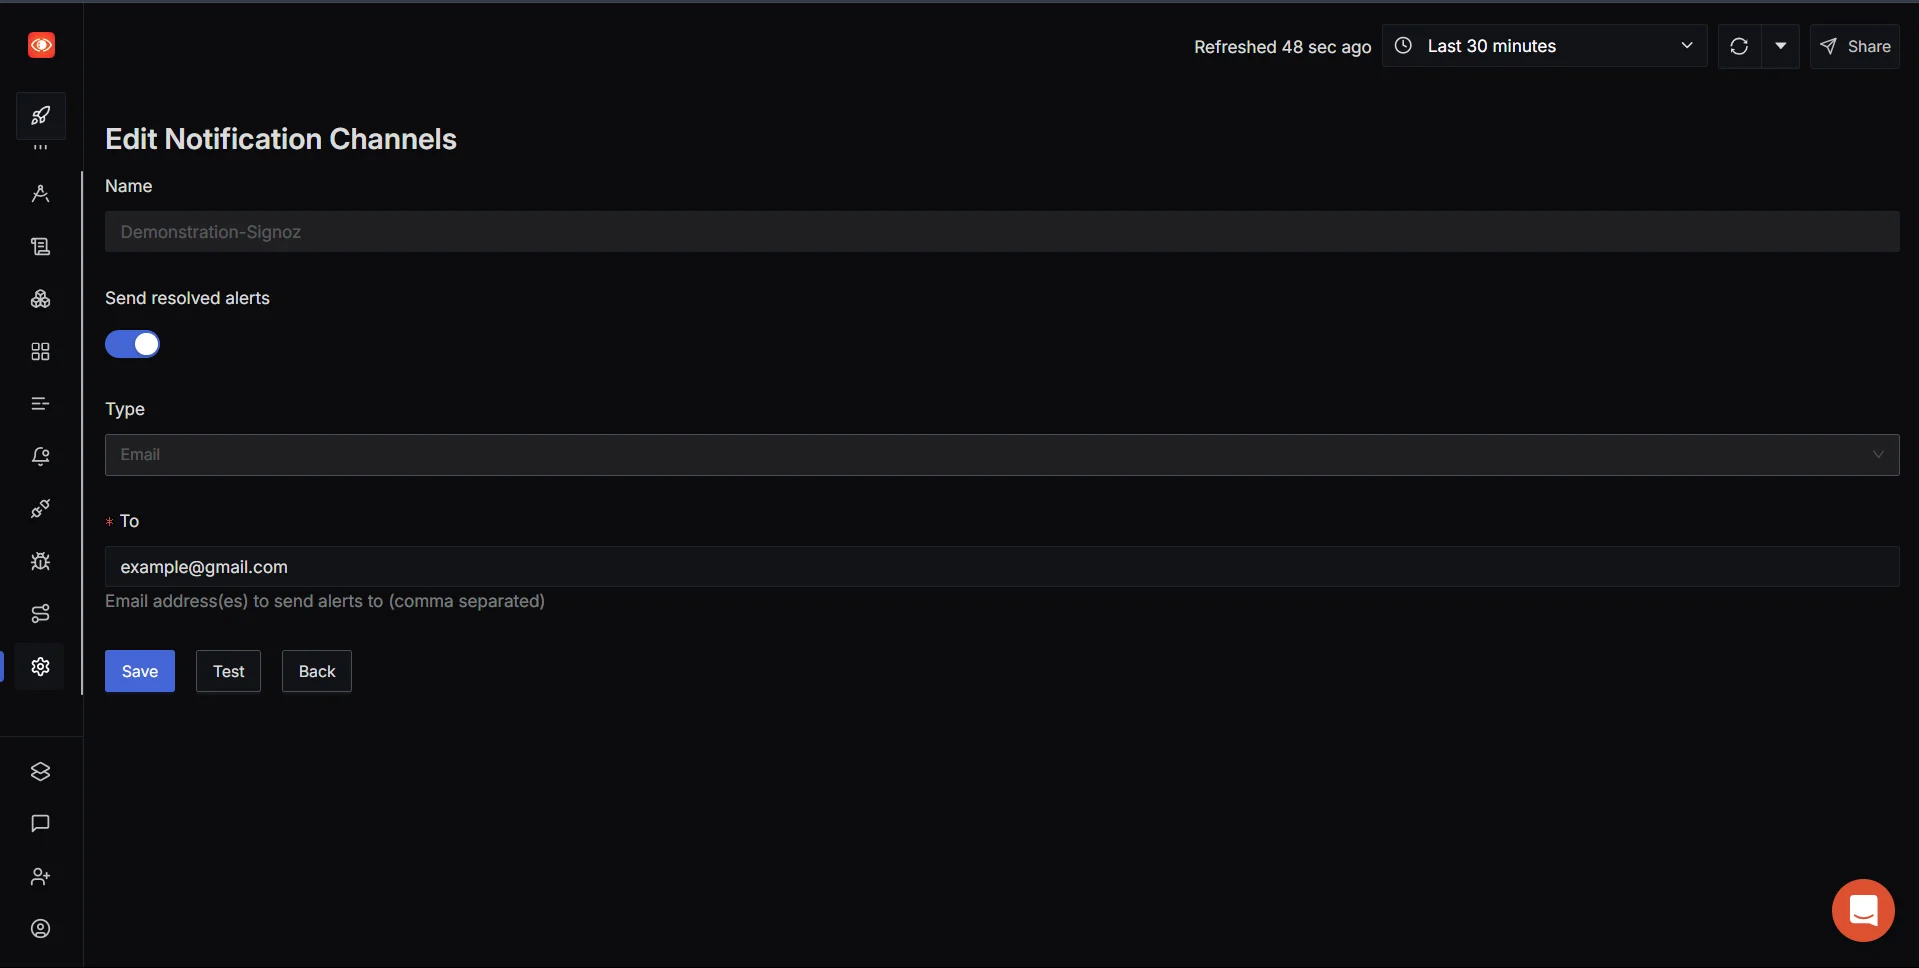
To set up an alert channel in SigNoz, go to SigNoz → Settings → Alerts → Create New Alert Channel. Provide a name for the alert channel, choose the type (e.g., email), add your email address, and click save.
Step 2: Create an alert trigger
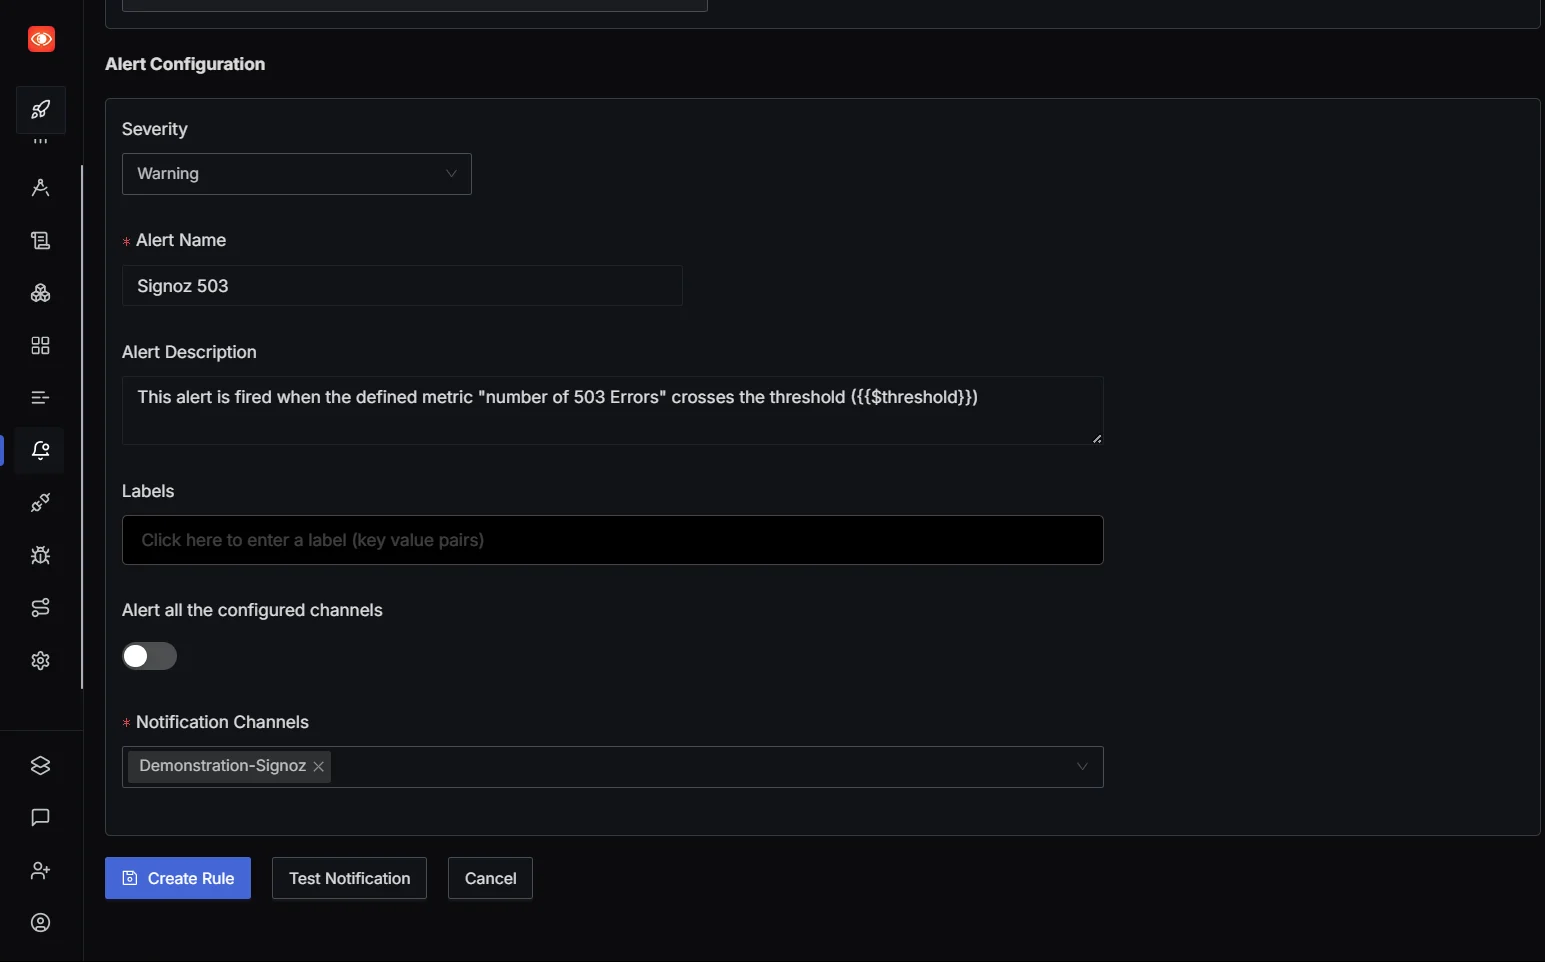
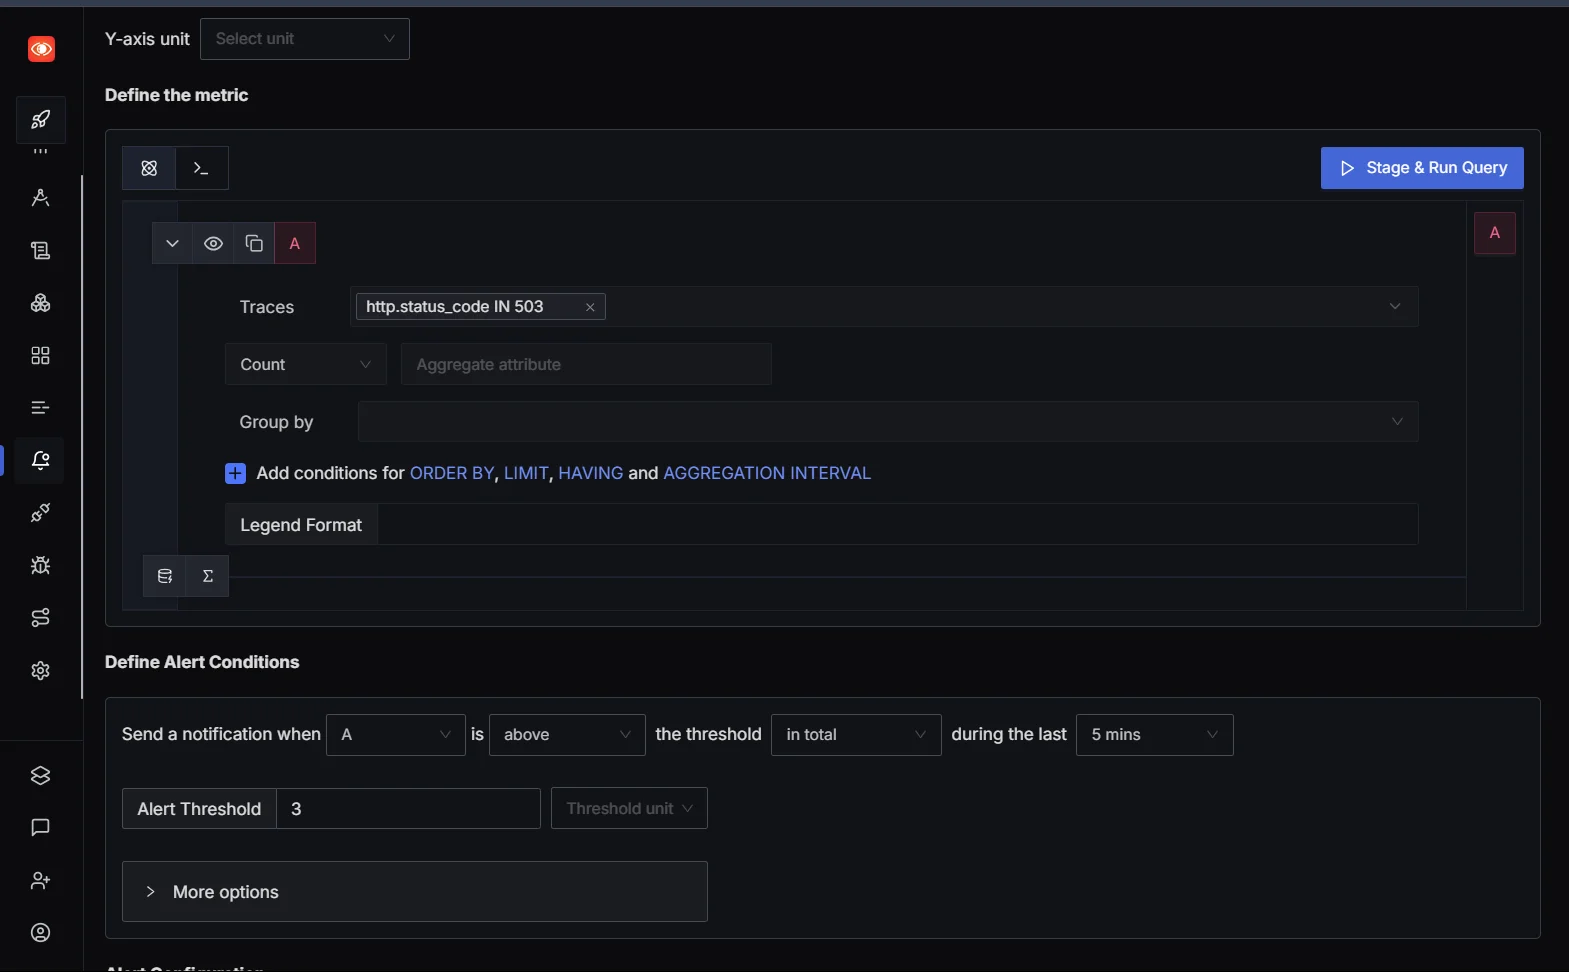
Next, we create an alert trigger that defines the conditions under which the alert will be triggered, such as when a metric exceeds or falls below a specified threshold. This ensures that we are notified whenever the system performance deviates from expected parameters. Simply set the desired condition and link it to the alert channel created earlier.
Go to Alerts → Select Trace-based alert (ideal for monitoring external APIs) → Configure the metrics to monitor, such as status codes (e.g., 503) → Click Stage to run the query.
Step 3: Define metrics and alert conditions
Set up the conditions for when the alert should be triggered, give your alert a name, define the threshold, and click save. Your alert system is now fully set up and ready to notify you when the specified conditions are met.
2. Automatically collect and visualize key incident management metrics
The app.py file provides endpoints for the actions performed in test.py, such as checking health and toggling downtime, and it also simulates a process request with random latency. By integrating OpenTelemetry, it tracks and logs the performance of each operation, allowing you to monitor the time it takes for each request to be processed—similar to how you’d track responses in the test script.
# app.py
from flask import Flask, jsonify
import random
import time
from opentelemetry import trace
from opentelemetry.sdk.trace import TracerProvider
from opentelemetry.sdk.trace.export import BatchSpanProcessor, ConsoleSpanExporter
from opentelemetry.instrumentation.flask import FlaskInstrumentor
from opentelemetry.instrumentation.logging import LoggingInstrumentor
from opentelemetry.instrumentation.requests import RequestsInstrumentor

# Initialize tracer
trace.set_tracer_provider(TracerProvider())
tracer = trace.get_tracer(__name__)
span_processor = BatchSpanProcessor(ConsoleSpanExporter())
trace.get_tracer_provider().add_span_processor(span_processor)

# Initialize Flask app
app = Flask(__name__)
FlaskInstrumentor().instrument_app(app)
LoggingInstrumentor().instrument()
RequestsInstrumentor().instrument()

# Simulate downtime toggle
downtime = False

@app.route("/health", methods=["GET"])
def health_check():
    # Health check endpoint.
    global downtime
    if downtime:
        return jsonify({"status": "down"}), 503
    return jsonify({"status": "up"}), 200

@app.route("/toggle-downtime", methods=["POST"])
def toggle_downtime():
    # Toggle downtime state.
    global downtime
    downtime = not downtime
    return jsonify({"downtime": downtime}), 200

@app.route("/process", methods=["GET"])
def process_request():
    with tracer.start_as_current_span("process_request"):
    # Random latency between 100ms and 2000ms
        latency = random.uniform(0.1, 2.0)
        time.sleep(latency)
        return jsonify({"message": "Processed", "latency": latency}), 200

if __name__ == "__main__":
    app.run(host="0.0.0.0", port=5000)
Now let’s run app.py the above code using:
opentelemetry-instrument python3 app.py
The below code in test.py is designed to test various endpoints of an OpenTelemetry application. It offers a simple command-line interface (CLI) to interact with the system, allowing you to check the health, toggle downtime, send a process request, or simulate load by sending multiple requests with a delay. Each option triggers the corresponding API call and shows the status and response from the server. It’s a straightforward way to test and interact with your application’s endpoints.
Here's how it works:
# test.py
import requests
import time

def test_health(base_url):
    print("Testing /health endpoint...")
    response = requests.get(f"{base_url}/health")
    print(f"Status: {response.status_code}, Response: {response.json()}")

def test_toggle_downtime(base_url):
    print("Testing /toggle-downtime endpoint...")
    response = requests.post(f"{base_url}/toggle-downtime")
    print(f"Status: {response.status_code}, Response: {response.json()}")

def test_process(base_url):
    print("Testing /process endpoint...")
    response = requests.get(f"{base_url}/process")
    print(f"Status: {response.status_code}, Response: {response.json()}")

def main():
    base_url = "YOUR_BASE_URL"
    print("Starting CLI Tester for OpenTelemetry Application")

    while True:
        print("*"*25)
        print("\nAvailable Commands:")
        print("1: Check Health")
        print("2: Toggle Downtime")
        print("3: Send Process Request")
        print("4: Simulate Load (Multiple Requests)")
        print("5: Exit")

        try:
            choice = int(input("Enter your choice: ").strip())

            if choice == 1:
                test_health(base_url)

            elif choice == 2:
                test_toggle_downtime(base_url)

            elif choice == 3:
                test_process(base_url)

            elif choice == 4:
                num_requests = int(input("Enter the number of requests to simulate: ").strip())
                delay = float(input("Enter delay between requests (in seconds): ").strip())
                for i in range(num_requests):
                    print(f"Request {i+1}/{num_requests}")
                    test_process(base_url)
                    time.sleep(delay)

            elif choice == 5:
                print("Exiting CLI Tester.")
                break

            else:
                print("Invalid choice. Please enter a number between 1 and 5.")

        except ValueError:
            print("Invalid input. Please enter a valid number.")

if __name__ == "__main__":
    main()
Output:
Starting CLI Tester for OpenTelemetry Application
*

Available Commands:
1: Check Health
2: Toggle Downtime
3: Send Process Request
4: Simulate Load (Multiple Requests)
5: Exit
Enter your choice: 1
Testing /health endpoint...
Status: 200, Response: {'status': 'up'}
*

Available Commands:
1: Check Health
2: Toggle Downtime
3: Send Process Request
4: Simulate Load (Multiple Requests)
5: Exit
Enter your choice: 4
Enter the number of requests to simulate: 10
Enter delay between requests (in seconds): 1
Request 1/10
Testing /process endpoint...
Status: 200, Response: {'latency': 0.2152963364170871, 'message': 'Processed'}
Request 2/10
Testing /process endpoint...
Status: 200, Response: {'latency': 1.8532910809529173, 'message': 'Processed'}
Request 3/10
Testing /process endpoint...
Status: 200, Response: {'latency': 1.8969696724059972, 'message': 'Processed'}
Note: Learn how to instrument your application to SigNoz Server in-depth here.
3. Correlate metrics with logs and traces for faster root cause analysis
When dealing with incidents, correlating metrics with logs and traces can make all the difference in quickly finding the root cause. By bringing these pieces of data together, teams can get a clearer picture of what went wrong, trace it back to the source, and fix the issue faster.
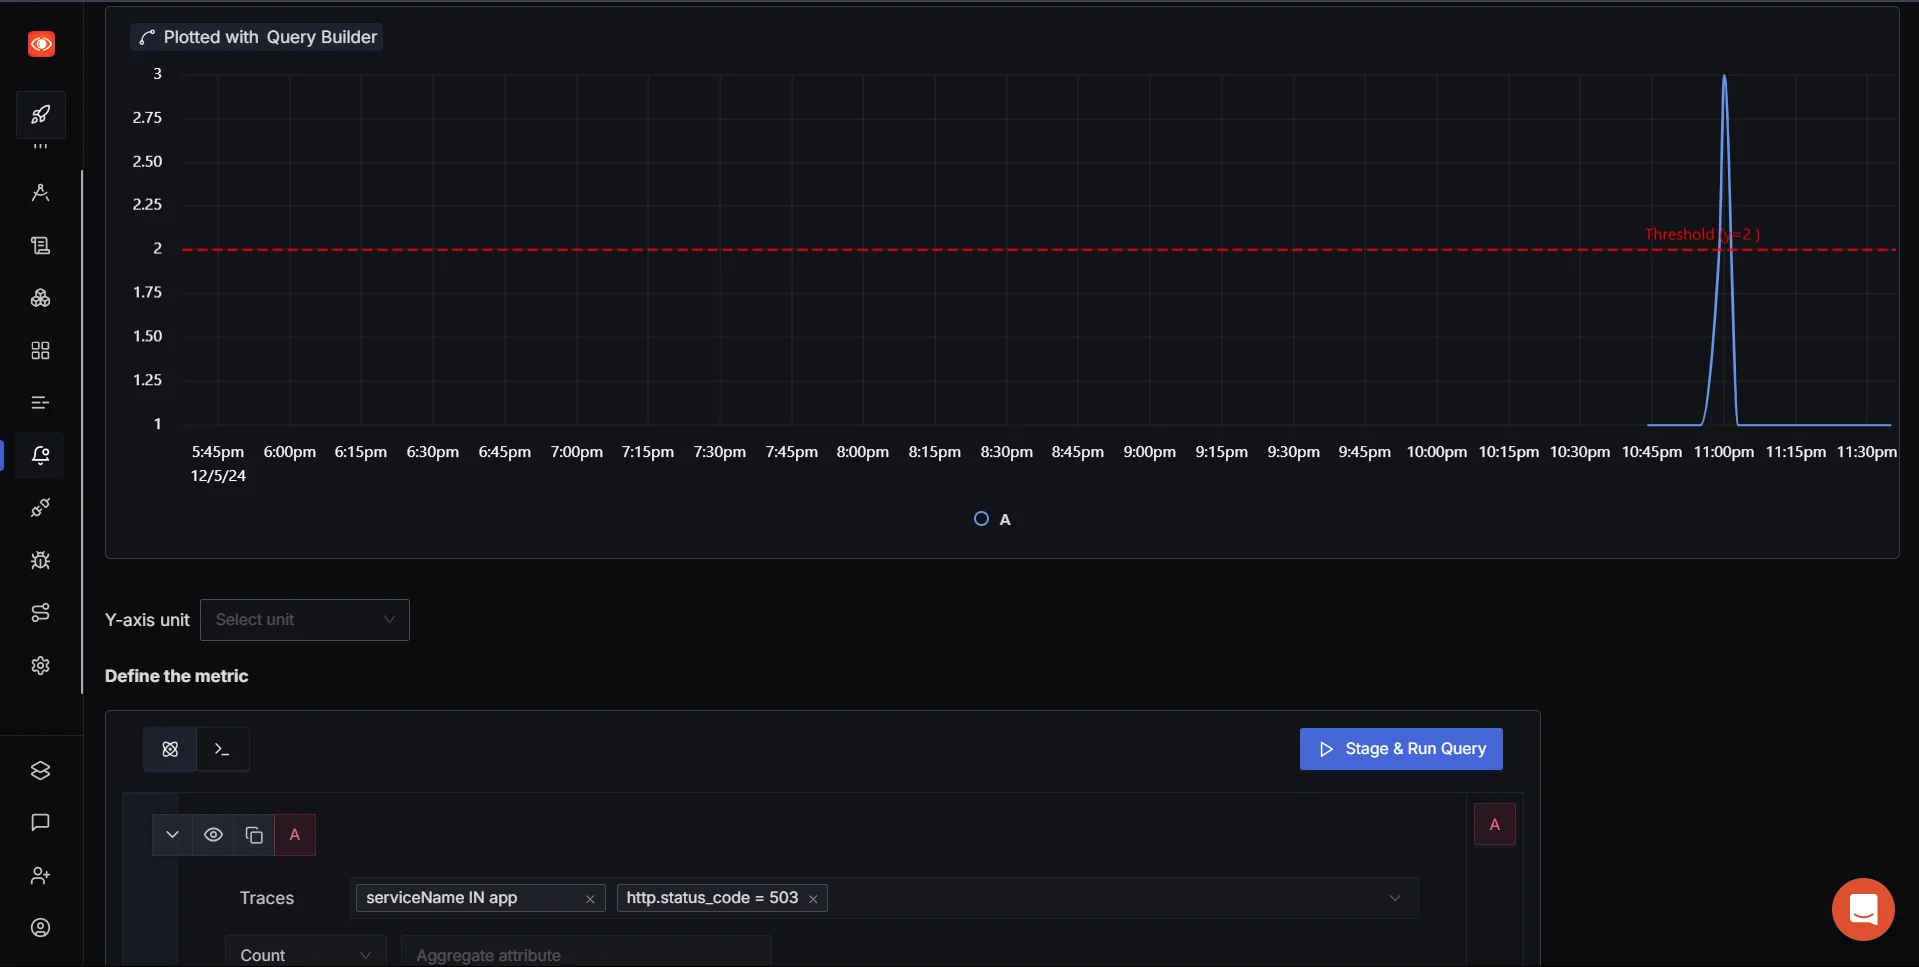
As you can see above, the moment threshold is crossed the status is then changed to Firing under triggered alerts tab on SigNoz dashboard.

When an incident metric that we defined earlier crosses the set threshold, an email is sent in the following manner:
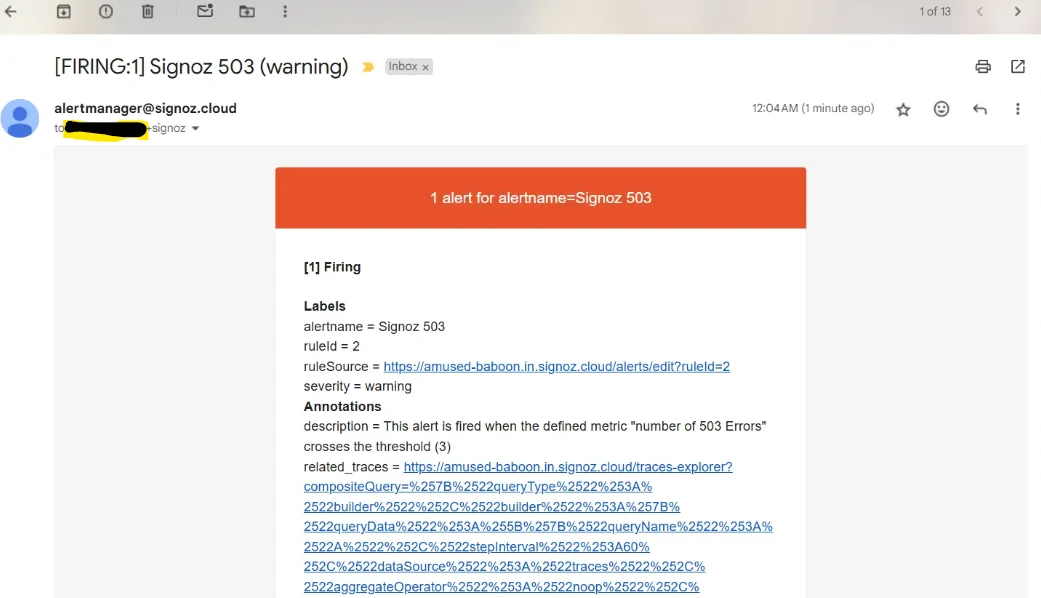
Get started with SigNoz to streamline your incident management process and gain deeper insights into your system's performance.
Incident Management Tools
Implementing an effective incident management process demands the right tools to streamline identification, assessment, response, and resolution, reducing the impact of IT issues.
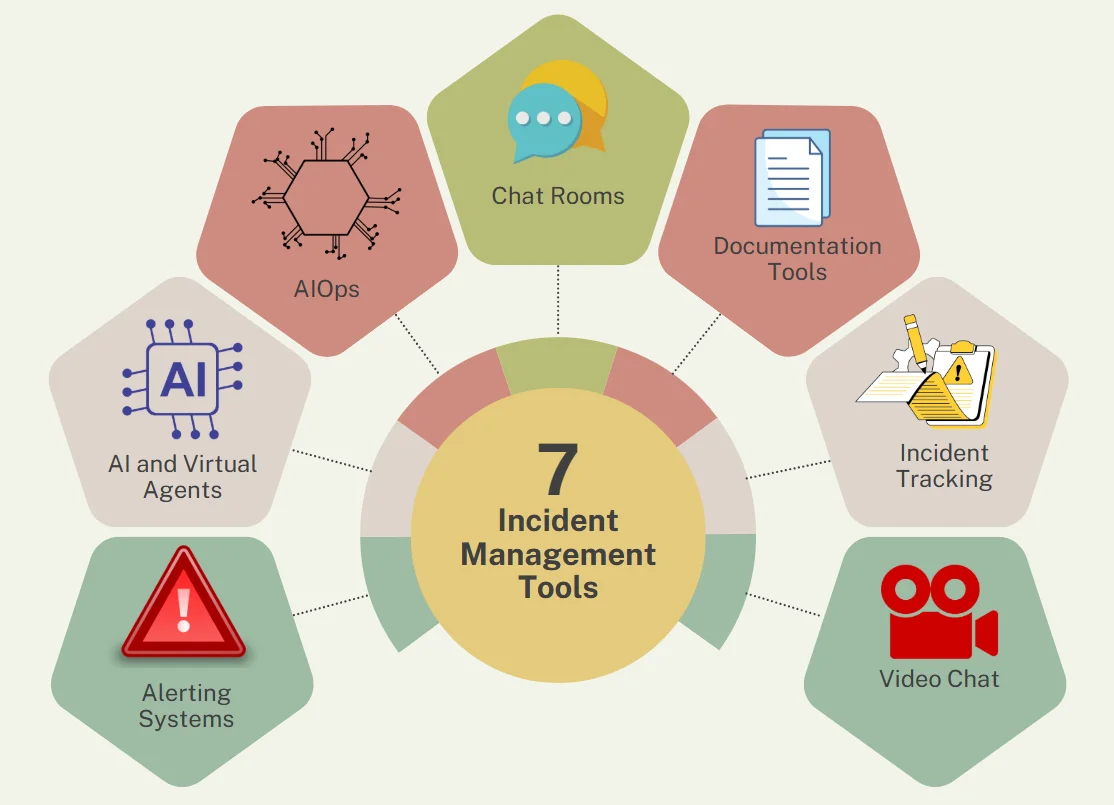
Here are key tools shaping modern incident management:
- Alerting Systems: These tools continuously monitor systems and send timely alerts when anomalies are detected, enabling teams to act quickly. They often classify incidents by severity, helping prioritize responses effectively.
- AI and Virtual Agents: AI enhances incident prediction, detection, and resolution by learning from past incidents, while chatbots handle routine queries and tasks, freeing up human resources for complex issues.
- AIOps: Leveraging machine learning and big data, AIOps automates IT operations, detects patterns and anomalies, suggests solutions, and proactively mitigates incidents.
- Chat Rooms: These provide a centralized platform for real-time collaboration, reducing communication gaps and expediting incident resolution, often integrated with file sharing and other tools.
- Documentation Tools: Organized documentation supports incident analysis, future prevention, and training. These tools simplify report creation with templates and collaborative features.
- Incident Tracking: Tracking tools log incidents from detection to resolution, aiding team assignments, progress tracking, and data analysis for identifying patterns and refining processes.
- Video Chat: Face-to-face communication aids in resolving complex incidents requiring cross-team collaboration, especially for remote or distributed teams. It also fosters stronger team dynamics.
These tools collectively enhance efficiency, collaboration, and preparedness in incident management.
Challenges of Incident Metrics: Beyond KPIs
Dependence on Limited Data
Metrics like KPIs offer an overview but often fail to highlight the "why" or "how" behind team performance, leaving critical insights unexplored.
Lack of Incident-Specific Context
KPIs can’t explain why some incidents take longer to resolve or why response times might vary unexpectedly. The nuances of each case often remain hidden.
Misleading Comparisons
Grouping fundamentally different incidents under the same metric can lead to inaccurate comparisons and misguided conclusions.
Overlooking Team Dynamics
Metrics don’t reflect how teams navigate unexpected challenges, handle risks, or manage the intricacies of incident resolution.
False Sense of Progress
KPIs may give a perception of success even when critical problem areas remain unaddressed, especially if metrics fail to improve.
Complexity of Unique Incidents
Incidents aren’t standardized processes. Two incidents of equal duration may differ greatly in risks, complexity, and the uncertainty they create.
KPIs as a Beginning, Not an End
While KPIs provide valuable initial insights, true progress demands going beyond surface metrics to uncover deeper trends and root causes.
Best Practices for Continuous Improvement
To drive ongoing enhancement of your incident management process:
Review Metrics Regularly
Evaluate your incident metrics every quarter to ensure they remain relevant and effective. Analyze incidents to uncover root causes and identify preventive measures. Take steps to avoid recurring issues, complete all documentation, and provide necessary training on liability and compliance.
Promote a Culture of Improvement
Empower teams to suggest and implement process enhancements based on insights from incident metrics. Encourage open feedback to drive meaningful changes.
Engage All Stakeholders
Incorporate perspectives from support teams, developers, and management when analyzing metrics and setting goals, ensuring a well-rounded approach.
Stay Flexible with Metrics
As your organization grows and evolves, update your metrics and targets to align with changing priorities and goals.
Optimize Alerts and On-Call Strategies
Prevent alert fatigue by categorizing events thoughtfully and setting up relevant alerts based on service level indicators (SLIs). Prioritize tasks like root cause analysis over superficial symptoms. Establish clear on-call schedules that consider individual workloads and incident volumes to ensure the right expertise is available when needed.
Key Takeaways
- Incident management metrics are quantifiable measures used to evaluate the performance and efficiency of an organization's incident response processes.
- To analyze incident volume, we track incidents by type, severity, and affected systems
- MTTR represents four different measurements—repair, recovery, respond, or resolve. While these metrics overlap, each has its own distinct meaning.
- Tracking the total number of incidents over time helps identify patterns, trends, and potential systemic issues. This metric is essential for capacity planning and resource allocation.
- CSAT provides direct feedback on how well your incident management process meets customer expectations. This metric helps identify areas for improvement from the end-user perspective.
- Evaluate your incident metrics every quarter to ensure they remain relevant and effective. Analyze incidents to uncover root causes and identify preventive measures.
FAQs
What is the difference between MTTA and MTTR?
MTTA (Mean Time to Acknowledge) measures how quickly your team recognizes and responds to an incident alert. MTTR (Mean Time to Resolution) encompasses the entire incident lifecycle, from detection to final resolution. While MTTA focuses on initial response time, MTTR provides a broader view of overall incident handling efficiency.
How often should incident management metrics be reviewed?
Review your incident management metrics at least monthly to identify trends and areas for improvement. However, some metrics — like SLA compliance and critical incident response times — may require more frequent monitoring, potentially daily or weekly.
Can incident management metrics be applied to all types of organizations?
Yes, incident management metrics can be adapted for various organizations, from small startups to large enterprises. The key is to select metrics that align with your specific business goals, IT infrastructure, and incident management maturity level. Smaller organizations may focus on basic metrics like MTTR and incident volume, while larger enterprises might implement more sophisticated KPIs.
How do you balance speed and quality in incident resolution metrics?
Balancing speed and quality in incident resolution requires a multi-faceted approach:
- Track both speed-related metrics (e.g., MTTR) and quality indicators (e.g., First Touch Resolution Rate, CSAT).
- Implement a tiered response system that prioritizes critical incidents for rapid resolution.
- Conduct post-incident reviews to ensure that quick fixes don't lead to recurring issues.
- Use automation and AI to speed up routine tasks while allowing human expertise to focus on complex problems.
By monitoring a balanced set of metrics and continuously refining your processes, you can achieve both rapid response times and high-quality incident resolutions.
