Metric division is a powerful technique in Prometheus for deriving meaningful insights from time series data. It allows you to compare metrics on different scales, calculate rates and efficiency metrics, and identify trends and anomalies. This blog post will explore the concept of metric division in Prometheus, its importance for data analysis and monitoring, common use cases, step-by-step guide for performing division, advanced techniques, visualization in Grafana, and real-world examples.
Quick Guide: Dividing Metrics in Prometheus
Basic Division Syntax
metric_a / metric_b
Common Use Cases
- Error Rate Calculation
sum(rate(response_status{status=~"4..|5.."}[5m])) / sum(rate(http_requests_total[5m])) * 100
- Resource Utilization
(node_memory_MemTotal_bytes - node_memory_MemAvailable_bytes) / node_memory_MemTotal_bytes * 100
- Average Response Time
rate(http_response_time_seconds_sum[1m]) / rate(http_response_time_seconds_count[1m])
Key Steps for Metric Division
- Identify Your Metrics
- Ensure both metrics exist and are being collected
- Verify metrics are compatible for division
- Check that units and scales make sense together
- Handle Labels
Use
ignoring()to exclude irrelevant labels:metric_a / ignoring(status_code, handler) metric_bUse
on()to specify which labels to match:metric_a / on(service, environment) metric_b
- Avoid Common Pitfalls
Prevent division by zero using
clamp_min:metric_a / clamp_min(metric_b, 1)Aggregate high-cardinality metrics before division:
sum without(instance, pod) (metric_a) / sum without(instance, pod) (metric_b)
- Optimize Performance
- Use recording rules for frequently used calculations
- Apply appropriate time windows
- Aggregate data before division when possible
Best Practices
- Always use
rate()orincrease()when dividing counter metrics - Set up recording rules for complex or frequently used divisions
- Include appropriate time windows (e.g., [5m]) based on your needs
- Test queries on a small scale before applying to production
- Document your metric divisions and their purposes
Quick Troubleshooting
If you get no data:
- Verify both metrics exist
- Check label matching
- Ensure no division by zero
- Confirm time ranges align
If you get unexpected results:
- Verify units are compatible
- Check for label conflicts
- Ensure proper rate/increase usage
- Validate aggregation methods
This quick guide covers the basics of metric division in Prometheus, but there's much more to explore! Continue reading below for in-depth explanations, advanced techniques, real-world examples, and best practices for integrating these concepts into your monitoring workflow.
Understanding Metric Division in Prometheus
Metric division in Prometheus refers to the operation of dividing one metric by another to derive meaningful insights from the data. This operation is typically done within PromQL (Prometheus Query Language), where users can apply mathematical operations to time series data. This process helps transform raw metrics into meaningful insights, enabling better decision-making and system optimization.
Importance of Metric Division for Data Analysis and Monitoring
Metric division is essential for transforming raw metrics into more insightful data points that can be used to monitor the performance and health of systems. It helps to:
- Normalize Data: Dividing one metric by another can help compare values that differ in scale, enabling apples-to-apples comparisons (e.g., requests per second or error rates).
- Calculate Rates: Metric division is frequently used to compute rates, such as traffic rate (requests per second) or throughput.
- Measure Efficiency: Division allows you to calculate efficiency metrics, such as CPU utilization percentage, by dividing CPU time spent by the total time available.
- Analyze Trends and Anomalies: By deriving new metrics through division, you can highlight trends, patterns, and potential anomalies that may not be visible when looking at raw metrics.
Why Divide Metrics in Prometheus?
Dividing metrics in Prometheus provides significant advantages for system administrators, developers, and DevOps teams, helping them gain deeper insights and make data-driven decisions. Below are some common use cases where dividing metrics proves invaluable:
Error Rate Analysis
Dividing error counts by total requests helps you quantify error rates and prioritize fixes. This includes HTTP errors, application exceptions, and failed transactions.
Example: Monitor the percentage of HTTP errors in your web service:
# HTTP Error Rate
sum(rate(response_status{status=~"4..|5.."}[5m])) / sum(rate(http_requests_total[5m])) * 100
This query calculates the percentage of requests resulting in 4xx or 5xx status codes over a 5-minute window by dividing the number of error responses (status codes 4xx and 5xx) by the total number of HTTP requests.
Resource Utilization Insights
By dividing used resources by total capacity, you can calculate utilization percentages for CPU, memory, or disk. This helps in optimizing resource allocation and identifying overutilized or underutilized nodes.
Example: Calculate the memory utilization percentage for each node:
# Memory Usage
(node_memory_MemTotal_bytes - node_memory_MemAvailable_bytes) / node_memory_MemTotal_bytes * 100
This query calculates the percentage of memory in use by subtracting available memory from total memory and then dividing by the total memory.
Throughput Evaluation
Dividing metrics like request counts or response times helps measure system efficiency, assess performance bottlenecks, and ensure the system can handle traffic spikes.
Example: Calculate the average response time per request:
# Average Response Time
rate(http_response_time_seconds_sum[1m]) / rate(http_response_time_seconds_count[1m])
This query divides the total response time sum by the number of requests to compute the average response time per request.
Service-Level Objective (SLO) Monitoring
Tracking SLO compliance, such as availability or latency thresholds, often requires dividing successful operations by total operations to measure service reliability.
Example: Calculate service availability percentage:
# Availability Percentage
sum(rate(http_requests_total{status=~"2..|3.."}[5m])) / sum(rate(http_requests_total[5m])) * 100
This query calculates the percentage of requests resulting in successful 2xx or 3xx status codes over the total number of requests. This metric helps ensure your service meets uptime and reliability goals.
Trend Analysis and Forecasting
Dividing metrics over time enables the identification of usage patterns and trends. This helps in proactive scaling and planning for future capacity needs.
Example: Track storage utilization trends over time:
# Storage Utilization Percentage
(node_filesystem_size_bytes - node_filesystem_free_bytes) / node_filesystem_size_bytes * 100
This query computes the percentage of used storage capacity for filesystems. Monitoring this over time reveals usage patterns, enabling you to anticipate when additional capacity will be required.
PromQL, Prometheus Query Language, enables users to manipulate and analyze metrics with ease. It supports operations like dividing metrics to calculate rates, percentages, and averages, as sown above. PromQL’s flexibility allows for complex computations and the creation of meaningful insights, making it a crucial tool for effective monitoring and troubleshooting.
Prerequisites for Dividing Metrics in Prometheus
Before you start dividing metrics in Prometheus, it’s important to have a few basics in place to ensure a smooth and effective process:
- Understanding of Prometheus: Familiarize yourself with Prometheus' data model and how it stores and queries time series data.
- PromQL Basics: Have a working knowledge of PromQL syntax and operators, as these are essential for performing metric division.
- Well-Collected Metrics: Ensure that your metrics are properly collected and include relevant labels for accurate grouping and filtering.
- Metric Compatibility: Verify that the metrics you want to divide are compatible (e.g., they share the same labels and time series alignment) to avoid query errors or misleading results.
By covering these prerequisites, you’ll be better equipped to perform metric division confidently and avoid common mistakes along the way.
Step-by-Step Guide to Divide Two Metrics in Prometheus
Dividing metrics in Prometheus is a useful operation to calculate ratios, rates, and averages. Follow these steps to successfully divide two metrics:
- Identify the Metrics: Determine which metrics you want to divide. These could be counters, gauges, or other time series data that make sense for your use case.
- Use the Division Operator: In PromQL, use the division operator (
/) to divide the two metrics. The syntax for division in Prometheus is straightforward but requires careful handling of labels. - Handle Label Matching and Vector Operations: Metrics may come with different labels. Ensure that the labels match between the two metrics, or use the
on()orignoring()modifiers to align them correctly. - Normalize Data If Needed: Depending on the metrics, you may need to apply functions like
rate()oravg()to normalize data before dividing, especially when working with counters or histograms.
Example
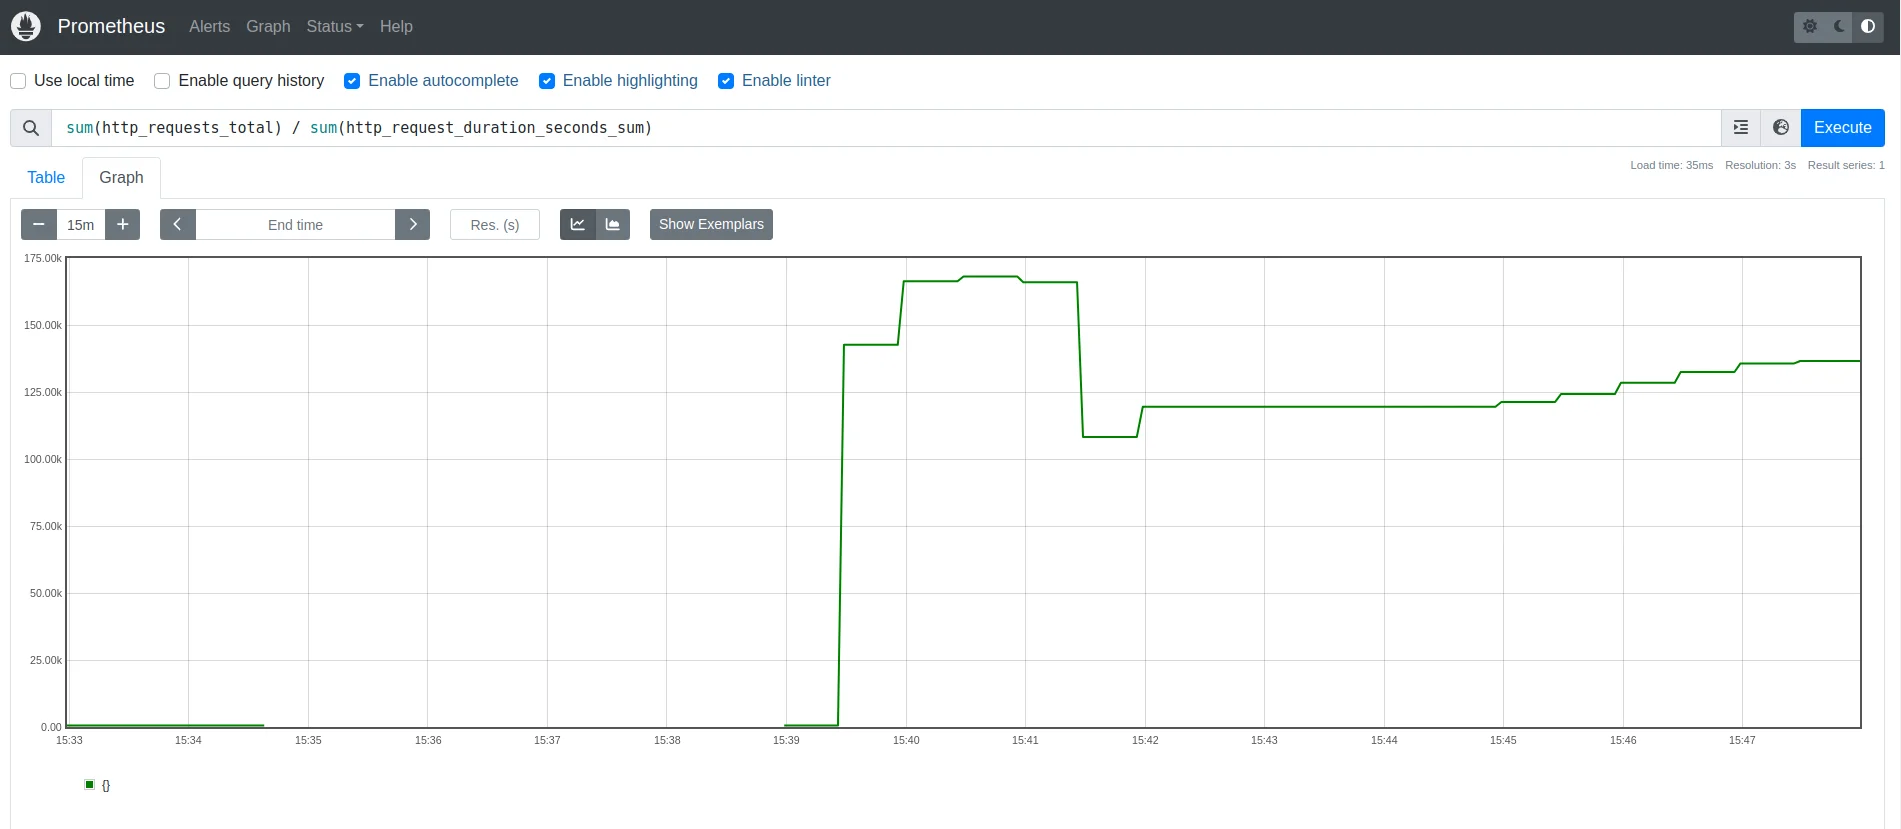
Here’s a basic example that divides two metrics:
sum(http_requests_total) / sum(http_request_duration_seconds_sum)
This query divides the total number of HTTP requests by the sum of their durations, giving you the average request rate.
Handling Label Inconsistencies
When dividing metrics with different label sets, there are several important considerations and techniques:
Label Matching Modifiers
When the metrics you're dividing have different labels, you can use the
ignoring()oron()clauses in PromQL to control how labels are matched during the divisionignoring(): This modifier excludes specific labels from being considered during the division. For example:rate(http_requests_total[5m]) / ignoring(status_code, handler) rate(http_request_duration_seconds_sum[5m])on(): This modifier ensures that only specific labels are used for matching between the metrics. For example:rate(http_requests_total[5m]) / on(service, environment) rate(http_request_duration_seconds_sum[5m])
Handling High Cardinality
High cardinality in metric labels (e.g., having many unique
instanceorpodlabels) can complicate the division process. To address this:Aggregate Labels Before Division: To manage high cardinality, it's advisable to aggregate metrics by labels like
instanceorpodbefore performing operations. Using thesum()oravg()functions with thewithout()modifier excludes high-cardinality labels. For example:sum without(instance, pod) (rate(http_requests_total[5m])) / sum without(instance, pod) (rate(http_request_duration_seconds_count[5m]))Recording Rules: Implementing recording rules to pre-aggregate metrics can help reduce high cardinality before performing operations. This strategy improves query performance and simplifies complex metric calculations
Label Matchers: Use label matchers to filter out specific values of labels that are irrelevant to the division. This helps focus the division on the most relevant metric subsets.
Grouping and Aggregation Strategies
To ensure the division provides meaningful results:
Group by Relevant Labels: Grouping by labels such as
serviceandendpointensures that the division reflects metrics at the appropriate level of granularity. For example:# Before aggregating and dividing, ensure these labels exist in both metrics sum by (service, endpoint) (rate(http_requests_total[5m])) / sum by (service, endpoint) (rate(http_request_duration_seconds_sum[5m]))Use
without()to Exclude Irrelevant Labels: Thewithout()modifier excludes unnecessary labels (likeinstanceorpod) from the aggregation, which helps in reducing noise and focusing on the most critical metrics.Consistent Aggregation: Ensure that the aggregation method is applied consistently across both the numerator and the denominator. For example, if you’re summing
http_requests_total, you should apply the same aggregation tohttp_request_duration_seconds_sum.Recording Rules for Complex Aggregations: When dealing with complex aggregation logic, use recording rules to pre-aggregate metrics before division. This reduces query complexity and improves performance, especially in large-scale environments.
Advanced Techniques for Metric Division
Here are some advanced methods for metric division in Prometheus:
Implementing Complex Calculations:
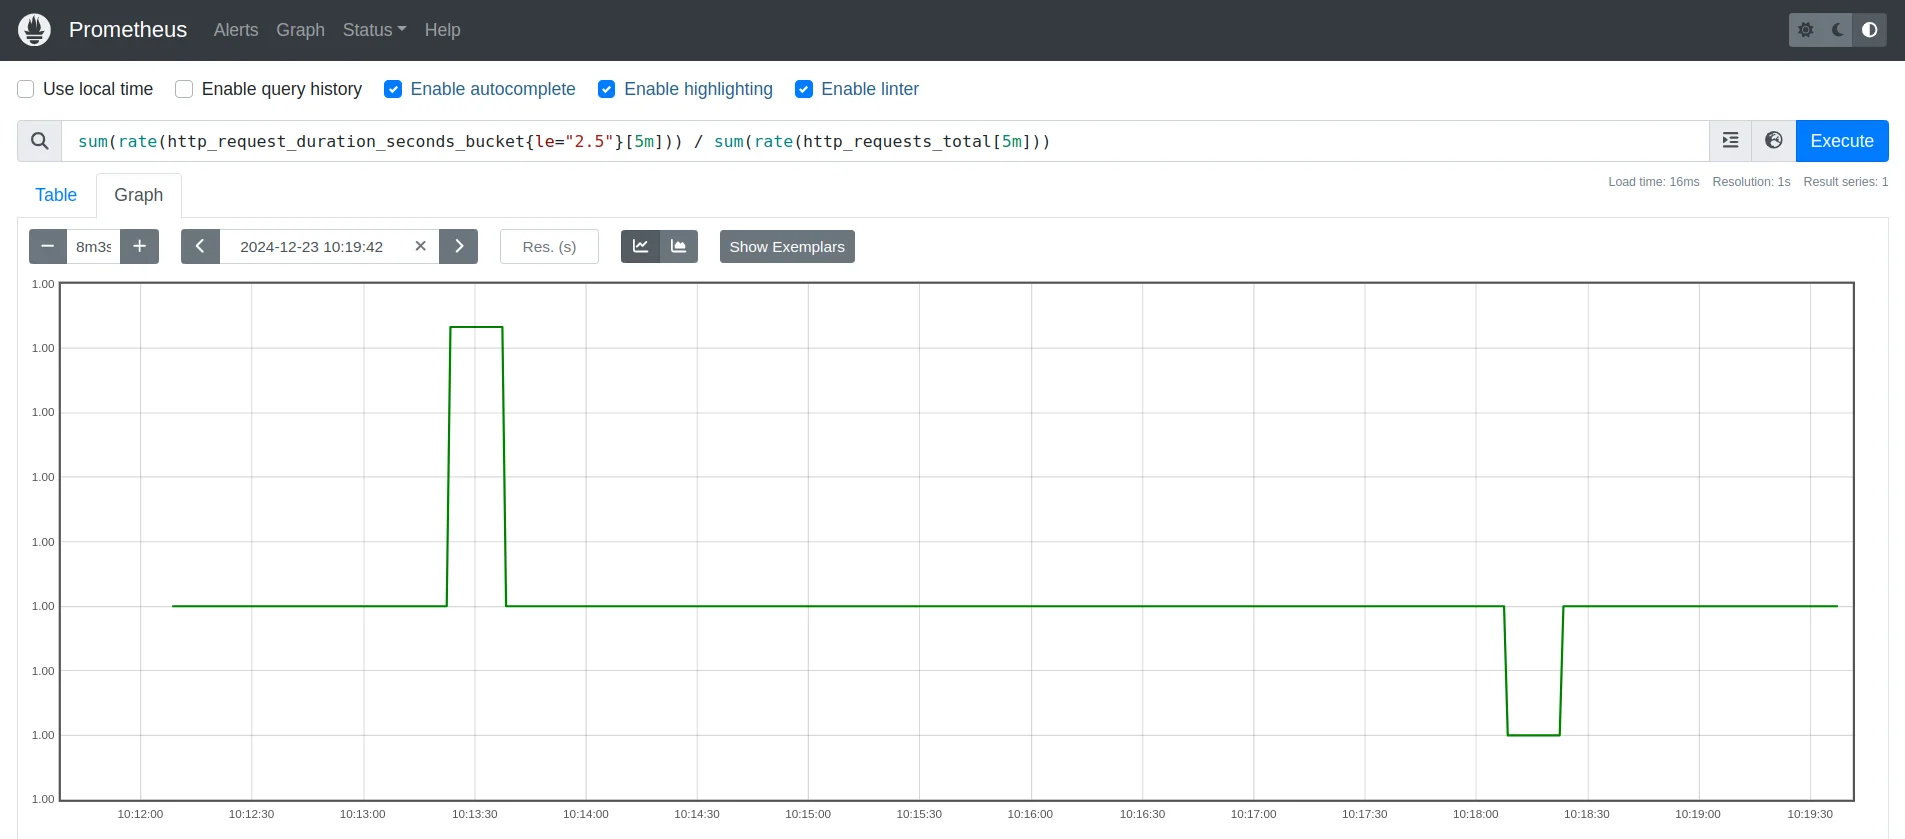
Advanced monitoring requires deriving actionable insights from raw metrics. By combining multiple PromQL functions, we can compute nuanced metrics, such as latency distributions or error-weighted durations, offering deeper performance analysis.
sum(rate(http_request_duration_seconds_bucket{le="2.5"}[5m])) / sum(rate(http_requests_total[5m]))This computes the ratio of requests with latency ≤2.5 seconds to the total requests. It's useful for identifying the proportion of slow responses within the system.
Ratio of requests with latency ≤2.5s to total requests Use Subqueries for Time-based Comparisons:
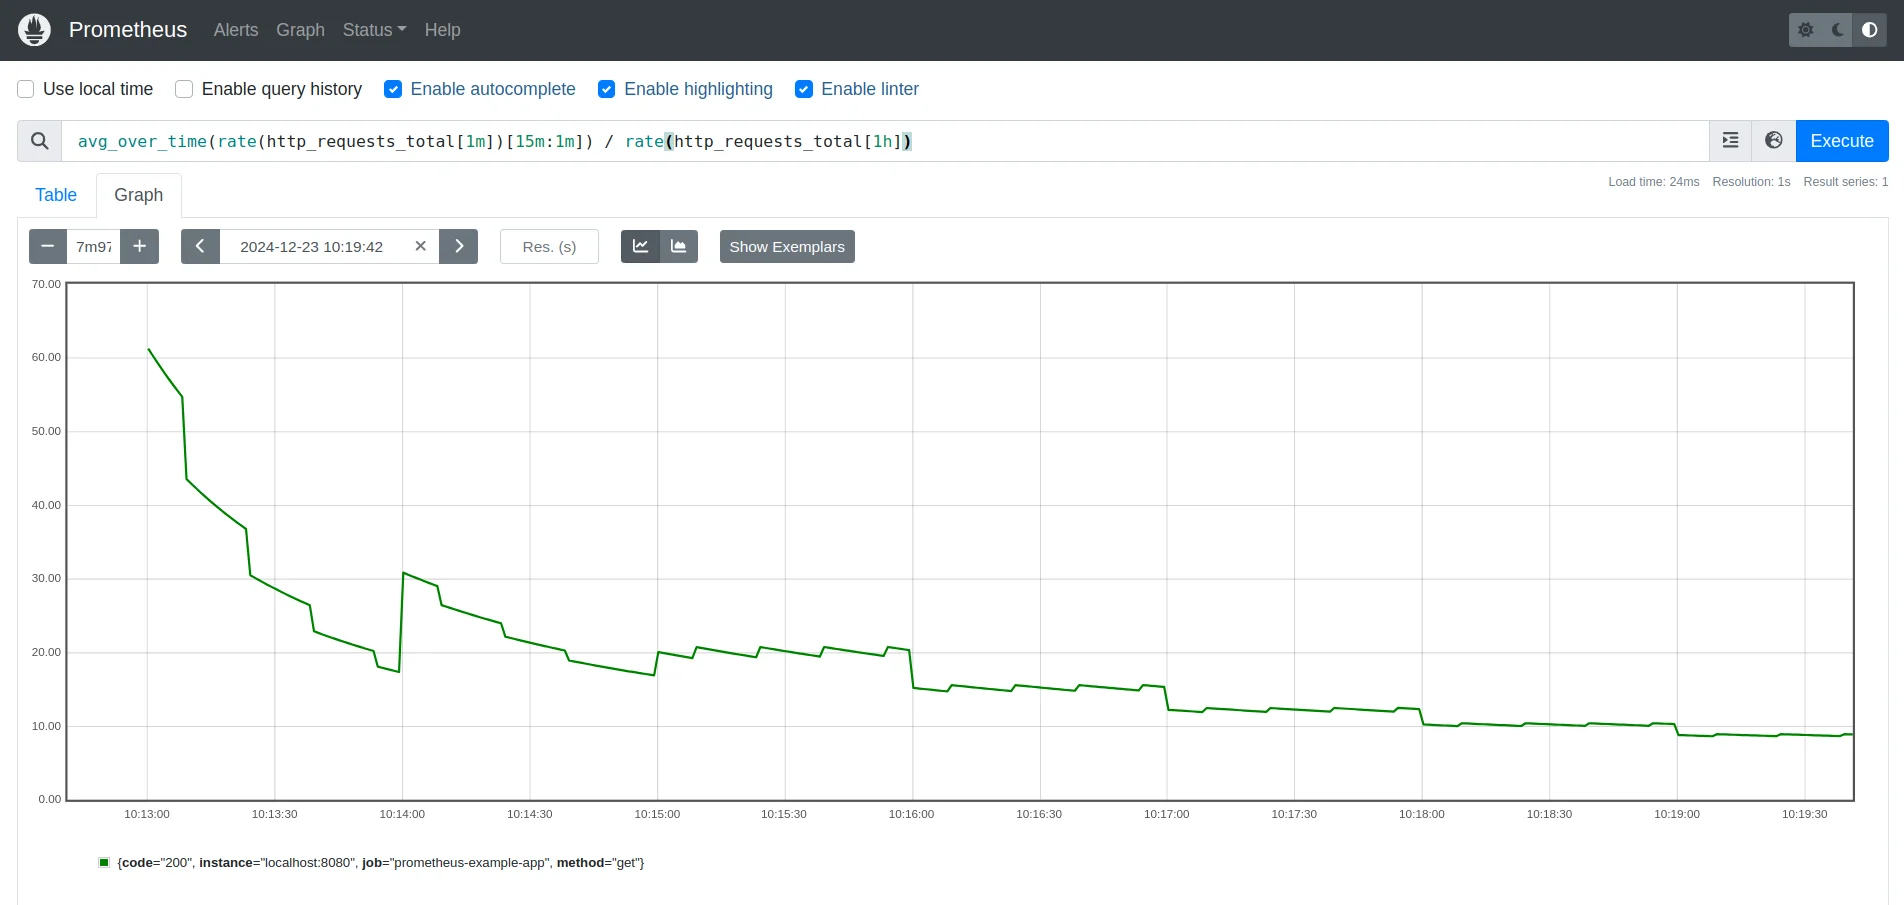
A subquery allows you to perform a query on data over a specific time range and then use the result of that query within another query. This enables time-based comparisons without needing separate queries
avg_over_time(rate(http_requests_total[5m])[15m:1m]) / avg_over_time(rate(http_requests_total[5m])[1h:5m])Here’s how it works:
avg_over_time(rate(http_requests_total[1m])[15m:1m]): Calculates the average rate of requests over a 15-minute window, with a resolution of 1 minute.avg_over_time(rate(http_requests_total[5m])[1h:5m]): Calculates the long-term rate using the same 5m sampling for comparison- Division (
/): Indicates whether the recent rate is steady compared to the long-term rate.
15-minute avg request rate vs 1-hour rate for traffic stability Apply Mathematical Functions to Division Results:
In monitoring systems, it’s essential to track the rate of HTTP requests to assess system performance. However, the raw output can often be fractional, making it harder to interpret. Applying mathematical functions like
ceil()makes these metrics more actionable.ceil(rate(http_requests_total{code="200",method="get"}[5m]))This PromQL query calculates the rate of successful HTTP GET requests (with a 200 status code) over the last 5 minutes. The
rate()function computes the per-second average of requests, and theceil()function rounds up the result to the nearest whole number. This helps users monitor the traffic of successful GET requests, providing insights into the system's performance in real-time.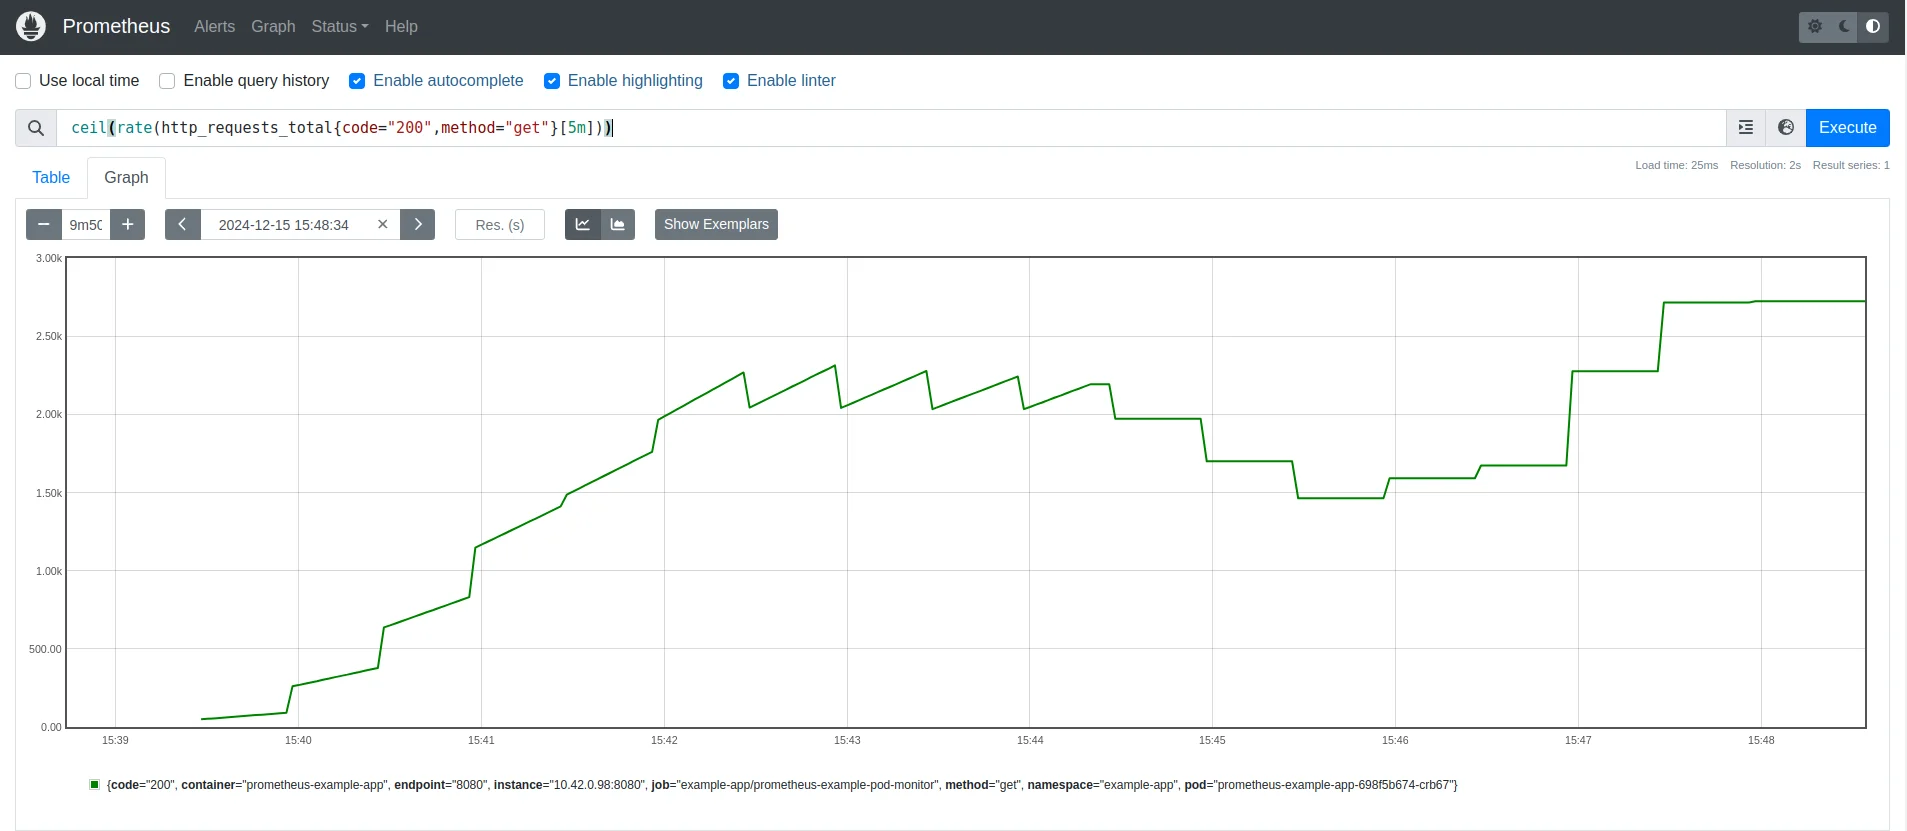
Rounding up requests per second for precise performance analysis. Handling Division by Zero (for Success Rate Calculation)
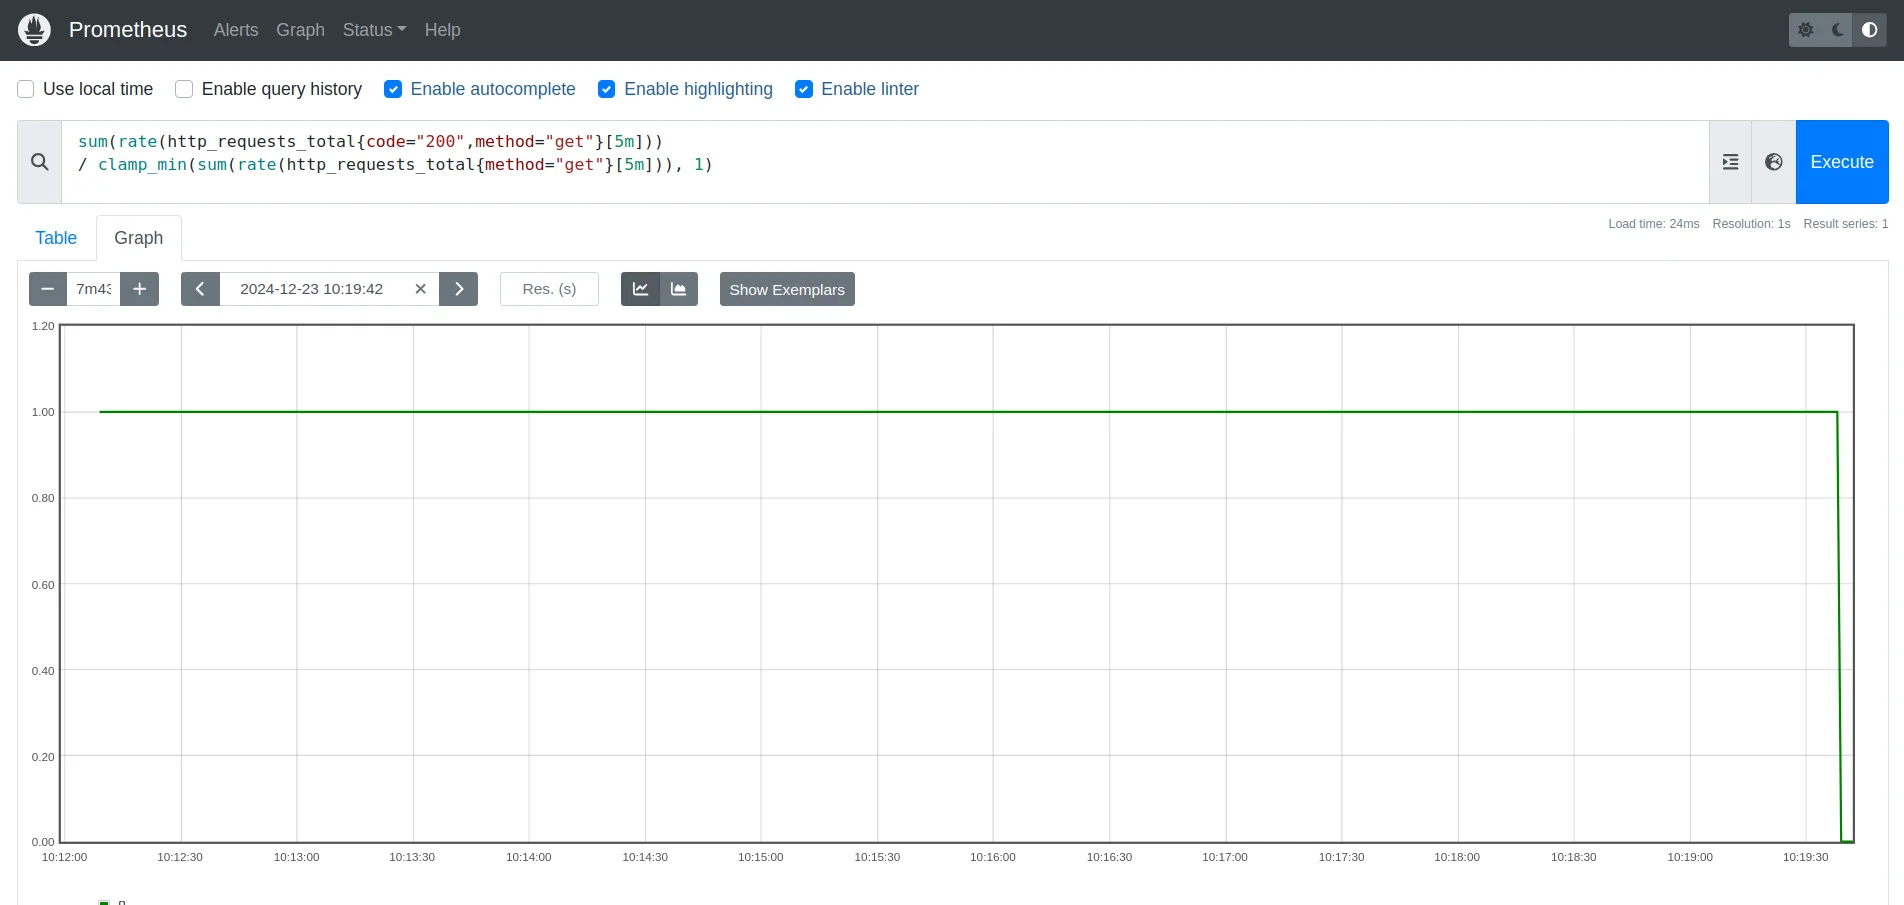
You might want to calculate the success rate of HTTP requests, but it's possible that there are no errors or no requests during certain periods, resulting in division by zero. You can safely handle this with clamp_min to avoid +Inf or division errors.
sum(rate(http_requests_total{code="200",method="get"}[5m]))
/ clamp_min(sum(rate(http_requests_total{method="get"}[5m])), 1)
rate(http_requests_total{code="200",method="get"}[5m]): The rate of successful GET requests (with a 200 status code) over the last 5 minutes.rate(http_requests_total{method="get"}[5m]): The rate of all GET requests over the last 5 minutes.clamp_min(..., 1): Ensures that the total GET requests never fall below 1, preventing division by zero.
This ensures that even if there are no requests, the denominator is set to 1, avoiding the risk of a +Inf result.
Visualizing Divided Metrics in Grafana
To retrieve data from Prometheus, Grafana must first establish a connection to the Prometheus data source. This process includes several steps:
- Set up Prometheus as a Data Source in Grafana
Navigate to Connections → Data Sources → Add data source in the left side panel.

Adding a data source in Grafana Enter the Prometheus server URL in the configuration field.
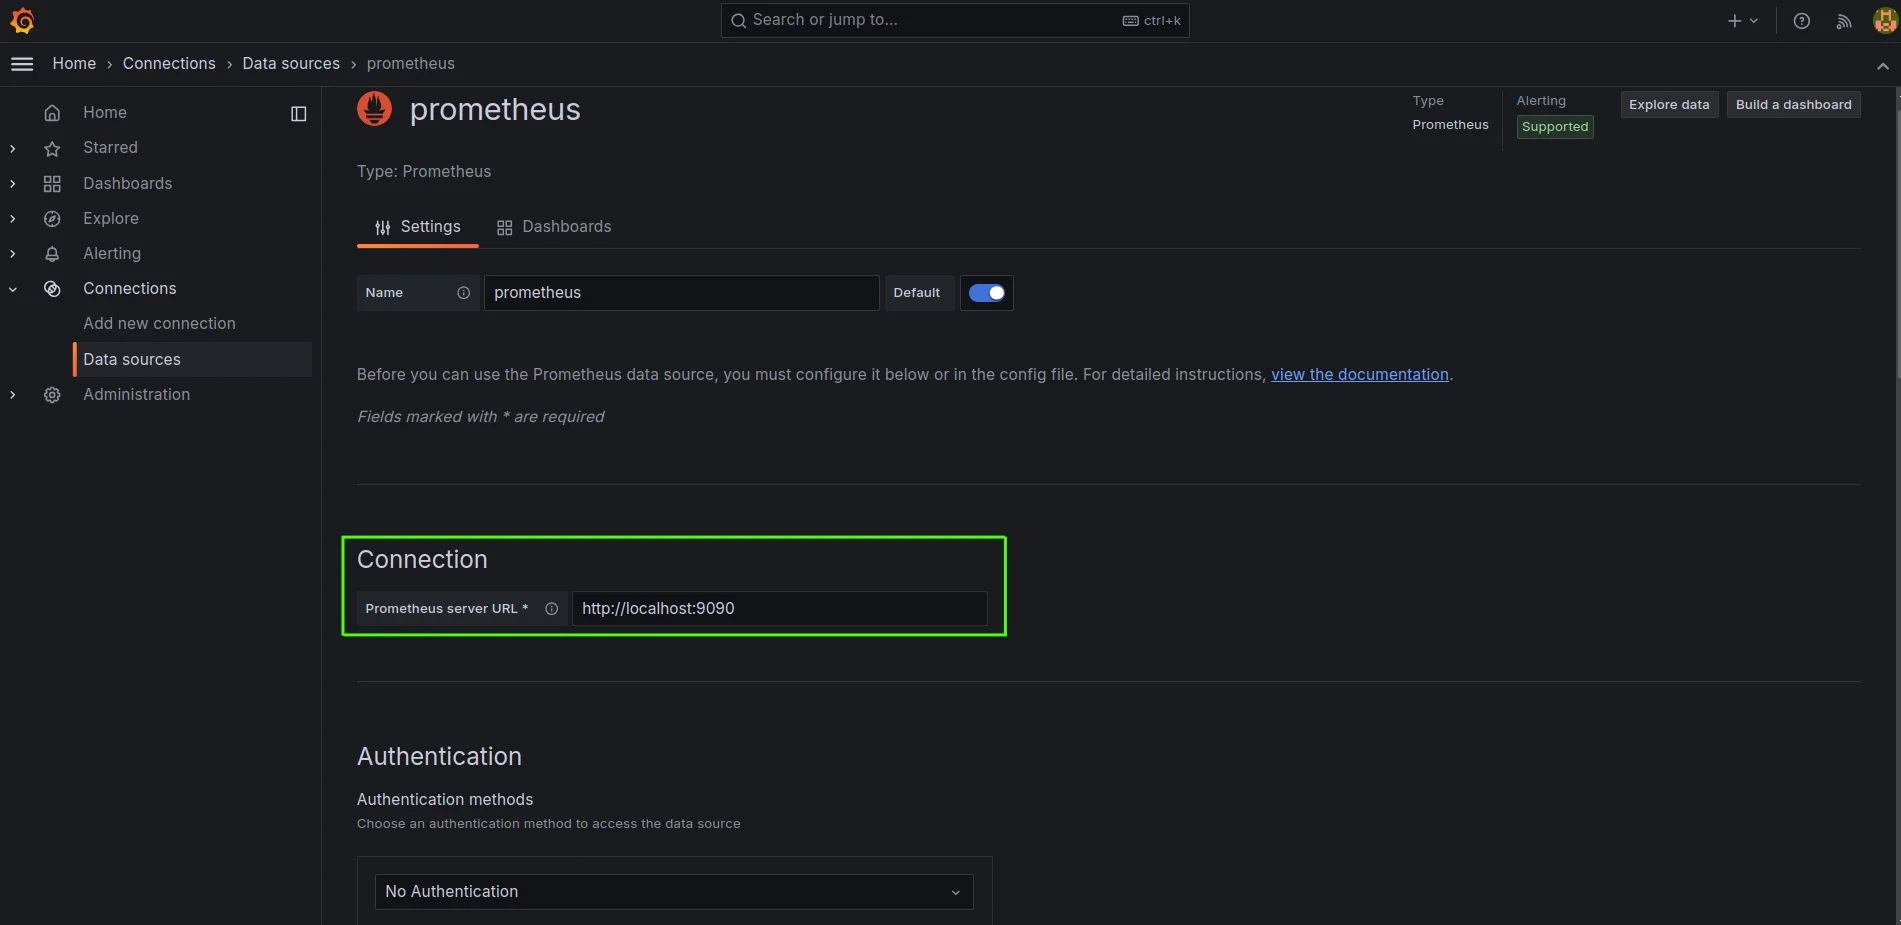
Enter Prometheus server URL in the config field Configure authentication settings (if required).
Click "Save & Test" to verify the connection
- Create a New Dashboard and Panel
Navigate to Dashboards → New Dashboard → Click on the Add Visualization button
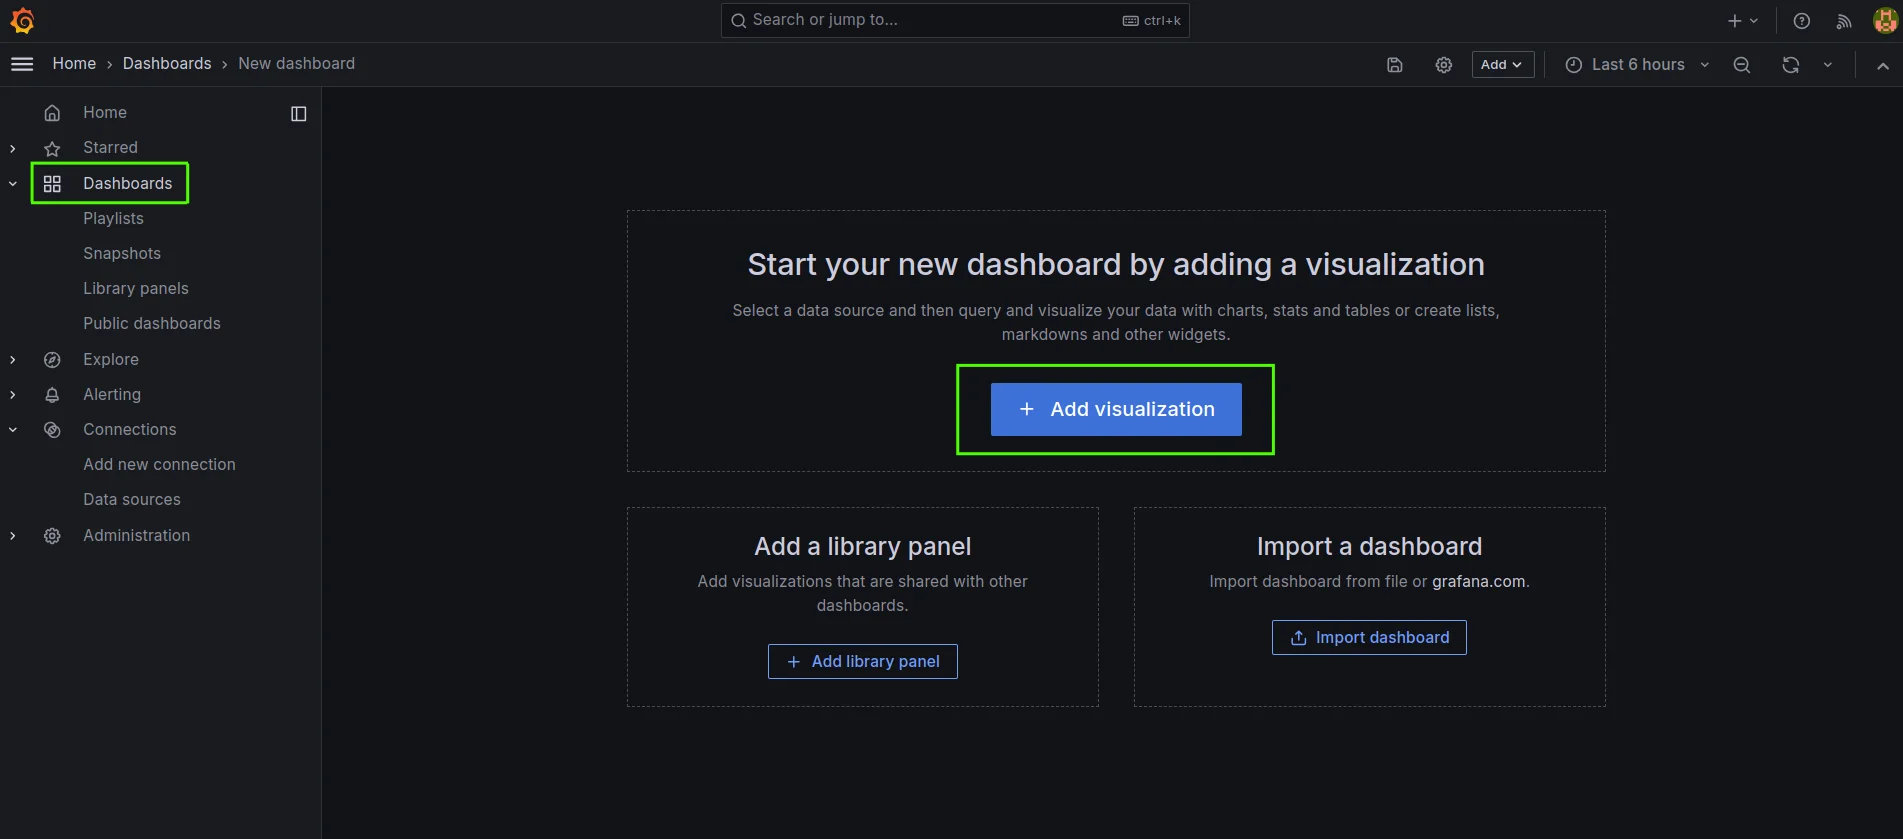
Create a new dashboard and add a visualization Select Prometheus from the data source dropdown
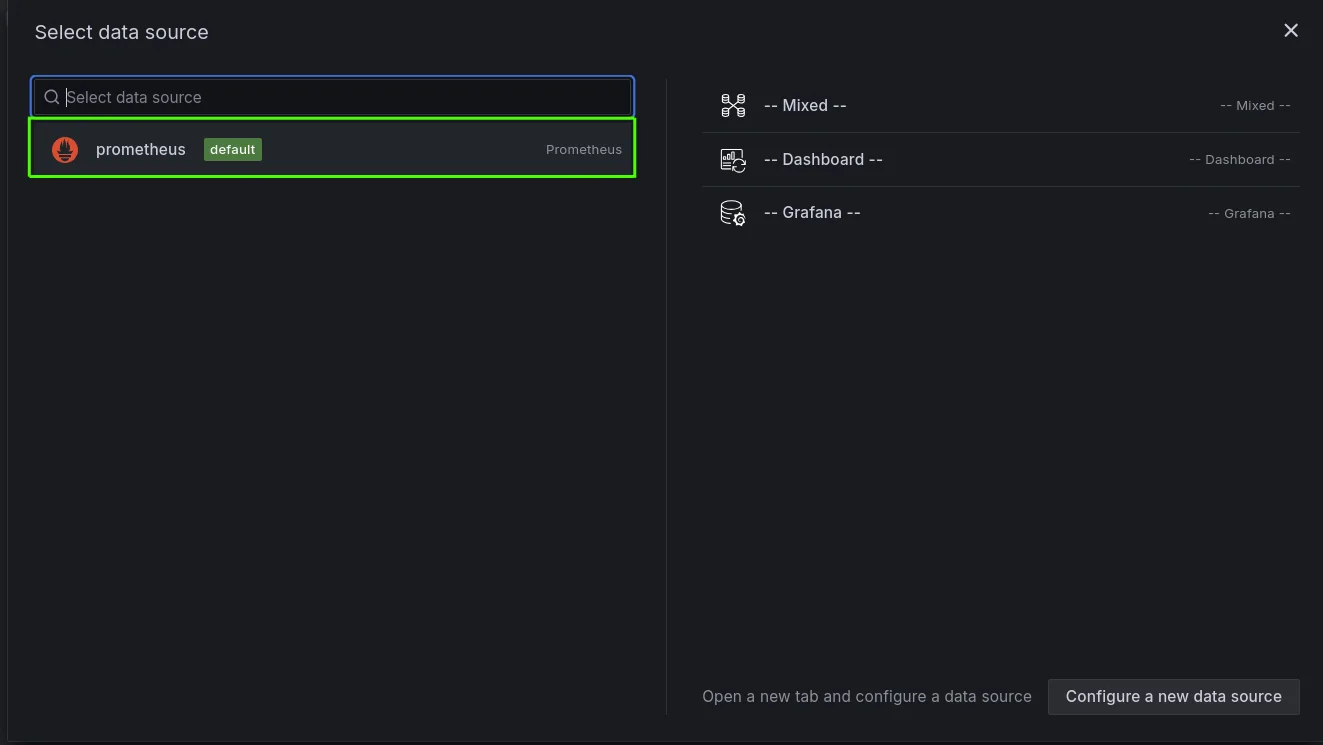
Select Prometheus as the data source Choose the appropriate visualization type
- Input Your PromQL Expression
In the query editor, enter your metric division expression. For example, to calculate the average request duration:
sum(rate(http_requests_total[5m])) / sum(rate(http_request_duration_seconds_sum[5m]))The query calculates the average request duration by dividing the total number of HTTP requests over 5 minutes by the total duration of those requests over the same period.
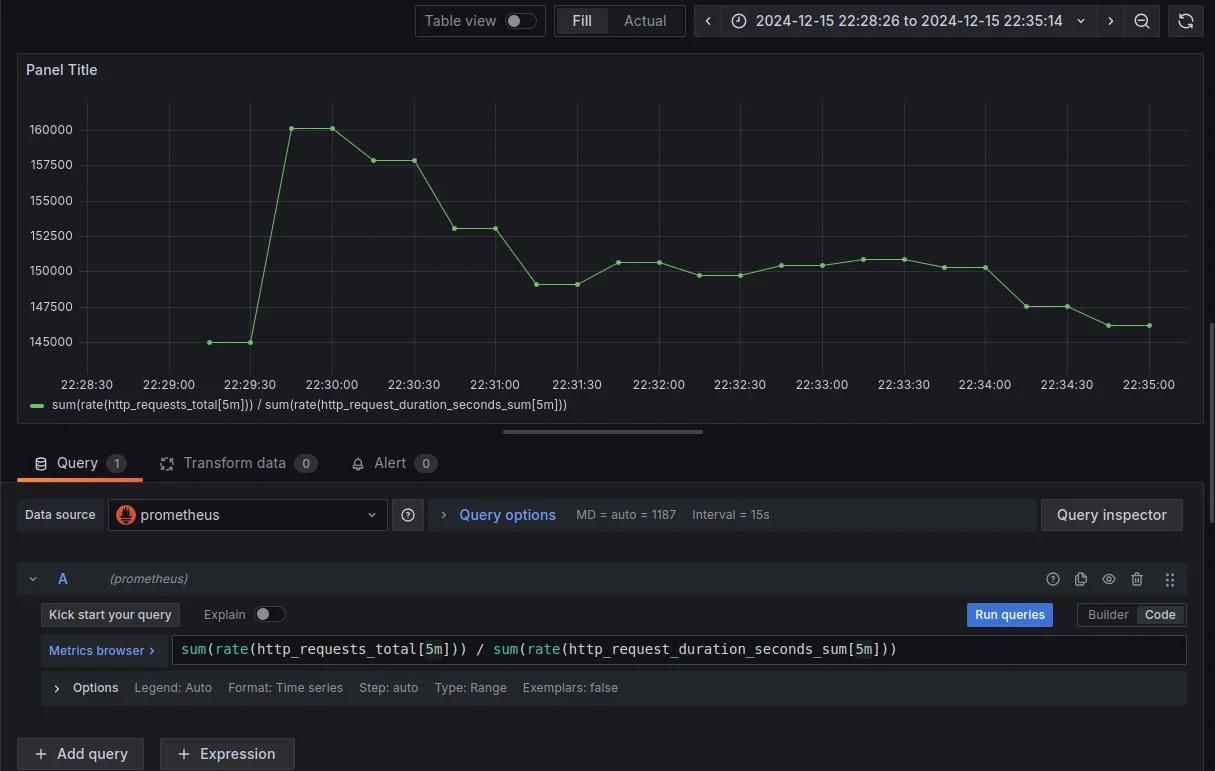
Visualizing the 5-minute error rate.
- Configure Visualization Options
Set appropriate units for divided metrics (e.g., percentages, ratios)
Configure panel display options (legend, axes, thresholds)
Use appropriate graph types (Time series for trends, Gauge for current ratios)
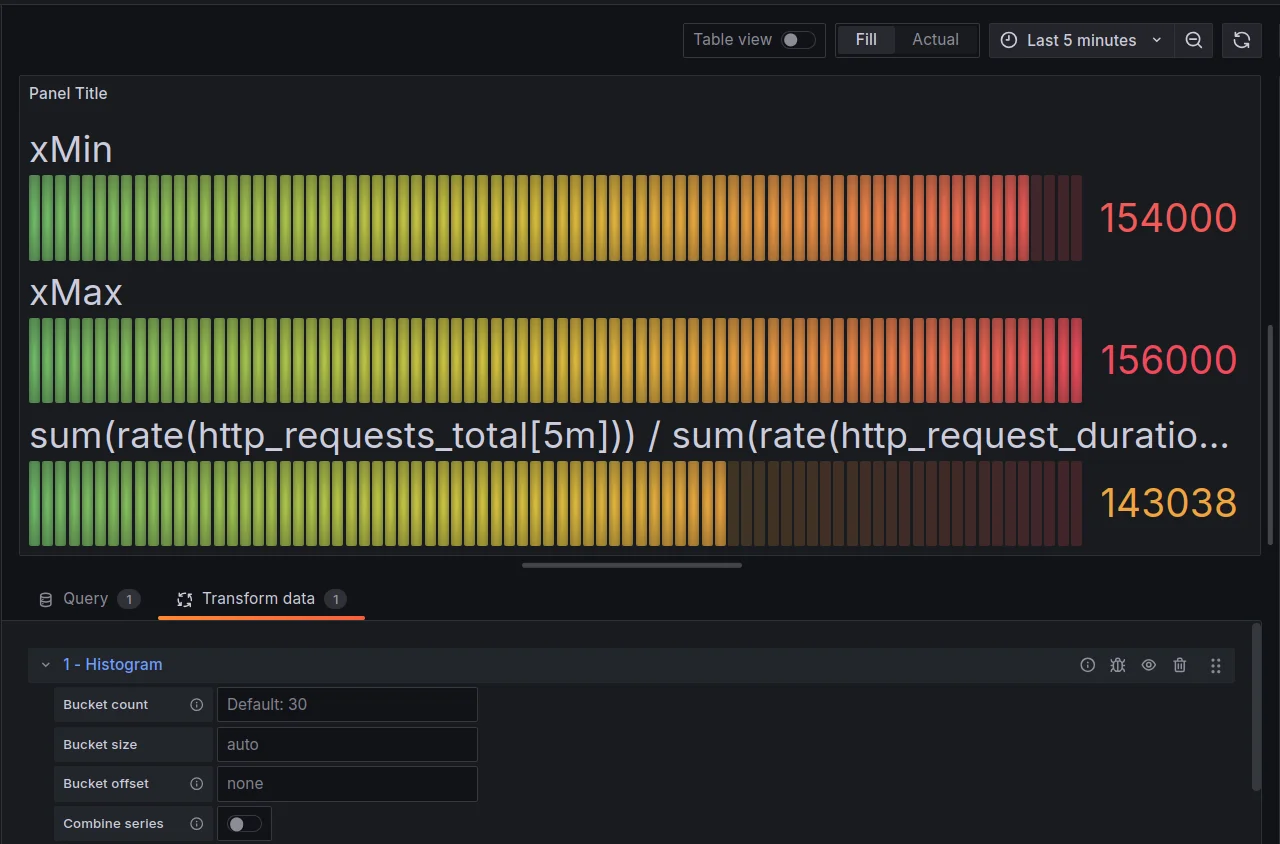
Enhance Visualization with Histogram Transformation for Performance Trends Apply Grafana transformations when needed:
- Reduce: For aggregating time series data
- Join: For combining multiple queries
- Group By: For organizing data by labels
Set meaningful thresholds and color schemes to highlight important values
Monitoring and Alerting with Divided Metrics
Monitoring and alerting based on divided metrics—such as error rates, request latencies, or throughput ratios—provide crucial insights into system performance. These metrics highlight proportional issues that raw, individual metrics may not capture, enabling proactive detection and faster resolution of incidents. Here’s how to set up and optimize alerting with divided metrics:
Setting Up Alerting Rules Based on Divided Metric Thresholds
To set up alerting rules, start by defining a Prometheus query that calculates the divided metric you're interested in. For example, to monitor the error rate as a percentage of total requests, you can use the following PromQL query:
rate(error_count[5m]) / rate(total_requests[5m])Once you have your query, proceed by creating an alerting rule in the Prometheus configuration. This rule will trigger an alert based on the value of the divided metric exceeding a specified threshold. For instance, you could set an alert if the error rate exceeds 1%, as shown in the following example:
groups:
- name: MetricDivisionAlert
  rules:
  - alert: HighErrorRate
    expr: (rate(error_count[5m]) / rate(total_requests[5m])) > 0.01
    for: 2m
    labels:
      severity: critical
    annotations:
      summary: "High error rate detected"
      description: "The error rate has exceeded 1%."
This configuration ensures that the alert is triggered if the error rate remains above 1% for at least 2 minutes, which helps avoid false positives caused by transient spikes.
Using Recording Rules to Pre-Compute Complex Divisions
Use recording rules in Prometheus to store pre-computed results for frequently queried divided metrics. This improves query performance and reduces computational overhead.
Below is an example of a recording rule that computes the average request duration over 5 minutes:
groups:
- name: divided_metrics
  rules:
  - record: job:average_request_duration:rate5m
    expr: sum(rate(http_requests_total[5m])) / sum(rate(http_request_duration_seconds_sum[5m]))
Once the metric is recorded, you can directly reference it in your alerting rules to trigger alerts based on pre-computed values:
expr: job:average_request_duration:rate5m > 2
Best Practices for Alert Sensitivity and Avoiding False Positives
To ensure that your alerts are meaningful and actionable, follow these best practices:
Use Appropriate Lookback Windows: Select the right time window for your alerts. Shorter windows (e.g.,
1m) are suitable for real-time alerts, while longer windows (e.g.,5m) help smooth out temporary spikes and prevent false positives.Use the
forClause: Add aforclause to ensure that alerts are only triggered if a condition persists for a defined duration. This helps avoid alerting on transient issues or brief spikes:for: 2mTune Thresholds Based on Historical Data: Adjust alert thresholds by analyzing historical data to ensure alerts are triggered appropriately. Fine-tuning thresholds helps avoid both false positives and missed alerts.
Integrating Alerts with Notification Systems
Integrating Prometheus alerts with notification systems ensures that you receive timely notifications in case of critical issues. Prometheus Alertmanager can be configured to send alerts to various platforms:
- Email: Set up SMTP configurations in Alertmanager to receive email alerts.
- Slack: Use Slack Webhooks to send alerts directly to specific Slack channels.
- PagerDuty: Integrate Alertmanager with PagerDuty for incident management and escalation workflows.
Example Alertmanager Configuration for Slack:
receivers:
- name: 'slack-alerts'
  slack_configs:
  - send_resolved: true
    channel: '#alerts'
    username: 'Prometheus'
    text: '{{ range .Alerts }}{{ .Annotations.summary }}\n{{ .Annotations.description }}\n{{ end }}'
    api_url: 'https://hooks.slack.com/services/your/slack/webhook/url'
Optimizing Performance When Dividing Metrics
Dividing metrics in Prometheus can provide valuable insights but may impact query performance due to the increased computational overhead of calculating ratios for each time series. High cardinality and complex divisions (involving many labels) can further strain resources, especially in large-scale environments. To optimize performance, consider the following strategies:
- Reduce Cardinality and Improve Query Efficiency
To improve the efficiency of queries involving divided metrics, consider the following strategies:
Reduce Unnecessary Labels: Avoid using high-cardinality labels (like unique IDs or timestamps) unless absolutely necessary. Use relabeling to drop unnecessary labels before metrics are stored.
metric_relabel_configs:
  - action: labeldrop
    regex: (id|timestamp|session_id)
Aggregation Before Division: Use functions like
rate(),sum(), oravg()to aggregate metrics before division.Limit Time Range: Query only the time range needed for your analysis. Longer ranges increase both computation time and memory usage.
Cache Frequently Divided Metrics
In high-query environments, dividing metrics with every query can slow response times. Caching frequently divided metrics can improve performance by:
- Reducing Redundant Calculations: Caching ensures division operations are only calculated once, reducing load and speeding up subsequent queries.
- Offloading Work: Caching lets Prometheus focus on tasks like data collection, while serving precomputed results for common queries.
- Faster Responses: Cached results are quickly retrieved, eliminating the need for repeated calculations.
Use Recording Rules
Recording rules in Prometheus allow you to precompute and store frequently used metric divisions, reducing the computational load during queries.
rules:
  - record: :http_request_success_ratio:5m
    expr: sum(rate(http_requests_success[5m])) / sum(rate(http_requests_total[5m]))
This strategy can significantly improve performance by:
- Precomputing Divisions: Recording rules calculate and store divisions ahead of time, simplifying queries and reducing execution time.
- Reducing Load: Precomputed results lower the need for repeated calculations, helping manage query load.
- Improved Efficiency: Using stored metric divisions speeds up queries, as real-time calculation is no longer required.
Troubleshooting Common Issues in Metric Division
When working with metric division in Prometheus, several issues can arise that affect query results or performance. Here are some common issues and how to address them:
- "No Data" Results in Divided Queries:
- Issue: When dividing two metrics, you might receive "no data" as a result, even if both metrics return valid data when queried individually.
- Resolution:
- Verify that the queried metrics exist within the selected time range.
- Check if the data source is correctly configured and actively scraping metrics.
- If one of the metrics returns zero for any value, dividing by zero will result in "no data." Check for zero values in both metrics.
- Timestamp Mismatches between Metrics:
- Issue: Metrics can have mismatched timestamps, meaning the data points from each metric do not align on the same time scale, leading to division errors or discrepancies.
- Resolution:
- Use the
rate()orirate()function to normalize counters over time. - Ensure time series are aligned by applying the
offsetmodifier or aligning query ranges.
- Use the
- Label Conflicts:
- Issue: If the two metrics being divided have different or conflicting label sets, the division operation might fail or produce inaccurate results.
- Resolution:
- Use
ignoring()oron()modifiers in PromQL to handle differences in label sets. - Ensure that relevant labels match across the metrics being divided.
- Use
- Scalar and Vector Mismatches in Division Operations:
- Issue: Dividing a scalar (single value) by a vector (multiple values) or vice versa can lead to unexpected results or errors in Prometheus queries.
- Resolution:
- Reduce cardinality by aggregating labels before performing the division.
- Use recording rules to precompute frequently used queries for faster results.
- Consider whether the operation makes sense mathematically and adjust the query accordingly
Enhancing Observability with SigNoz
SigNoz is a comprehensive observability platform designed to enhance your system monitoring and management. It provides insights into your application’s health with visualizations, metrics, logs, and traces. Built on OpenTelemetry, SigNoz offers a unified solution for collecting telemetry data, tracking performance, and efficiently troubleshooting issues, making it ideal for DevOps, SRE teams, and developers seeking deeper observability.
Seamless Integration of SigNoz with Prometheus for Advanced Metric Analysis
SigNoz integrates seamlessly with Prometheus by leveraging the OpenTelemetry collector to collect and ingest metrics from Prometheus, enhancing your existing observability stack. While Prometheus is excellent at gathering and storing metrics, SigNoz takes it further by enabling advanced metric division, aggregation, and visualization, making complex data analysis simpler and more intuitive.
Here’s how SigNoz enhances your Prometheus setup:
Native PromQL support
With SigNoz, you can leverage PromQL directly within the SigNoz platform. This feature allows you to perform metric divisions and calculations with ease. Whether you're interested in tracking error rates, resource utilization, or throughput, you can calculate these metrics directly from the query builder with just a few clicks.

Leveraging PromQL Query for custom dashboard generation Visualizing Divided Metrics
SigNoz provides an intuitive and powerful visual interface that allows you to display and analyze your divided metrics easily. Visualizing key performance indicators (KPIs) in a unified platform makes it simple to track trends, identify anomalies, and respond quickly to potential issues.
Example Query for Metric Division in SigNoz
system_cpu_load_average_5m / system_cpu_load_average_1mThis query calculates the ratio of the 5-minute average CPU load to the 1-minute average CPU load, helping you assess whether the system's load is increasing or stabilizing over time. By comparing longer-term trends (5 minutes) with short-term fluctuations (1 minute), you can gain valuable insights into your system's performance.
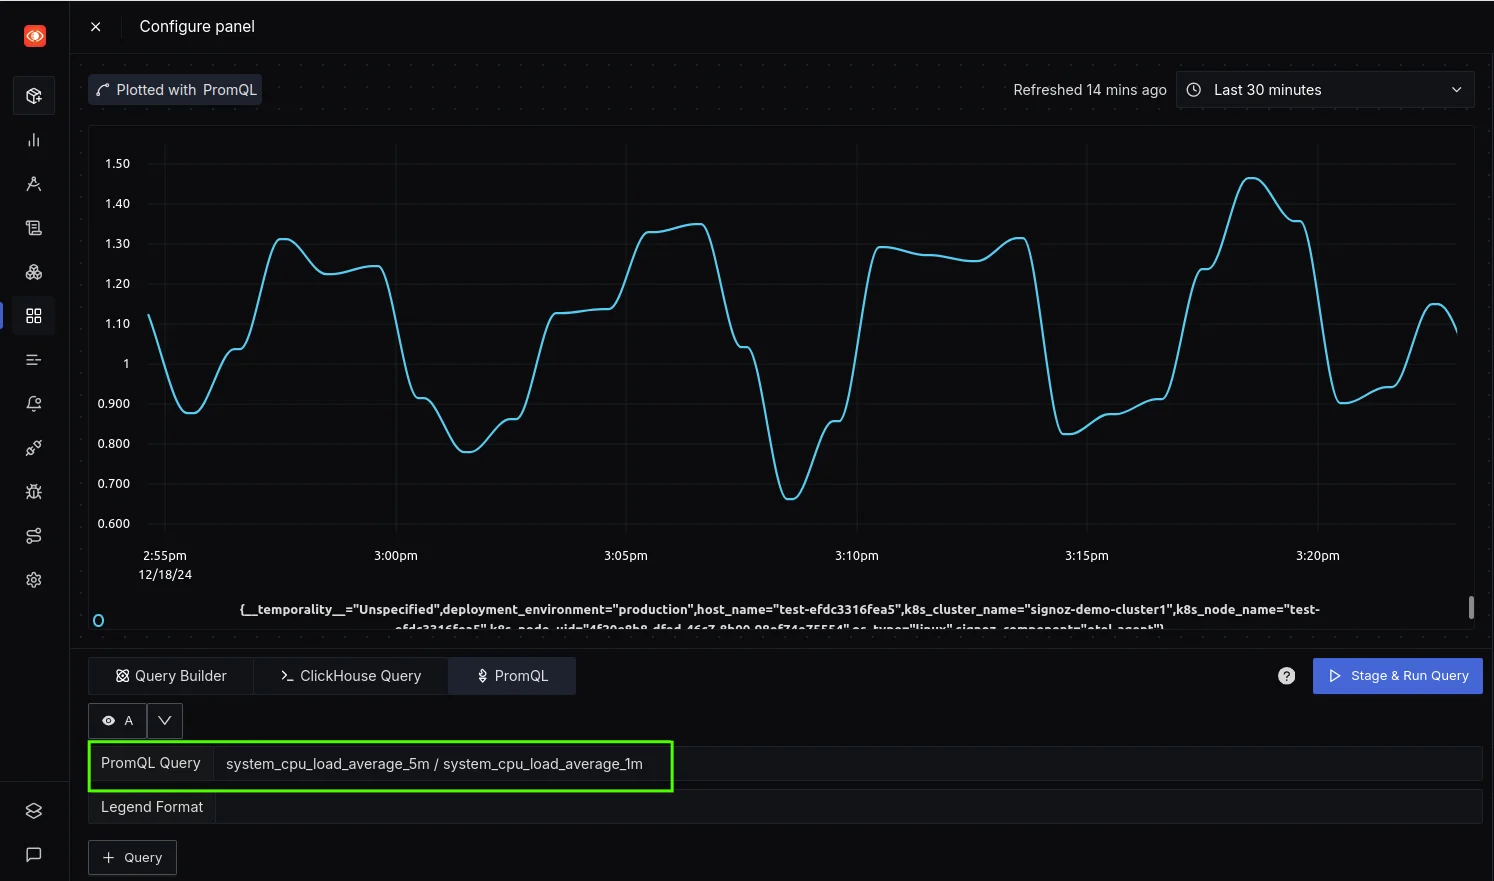
Tracking CPU Load Trends: 5-Min vs. 1-Min Average Ratio Proactive Alerts Based on Divided Metrics
Similarly, you can create alerts based on the same query provided, enabling proactive monitoring of system performance. By setting custom thresholds on divided metrics, SigNoz ensures you’re notified of potential issues before they impact your system. For more information on configuring custom metric alerts, refer to the Official SigNoz documentation.
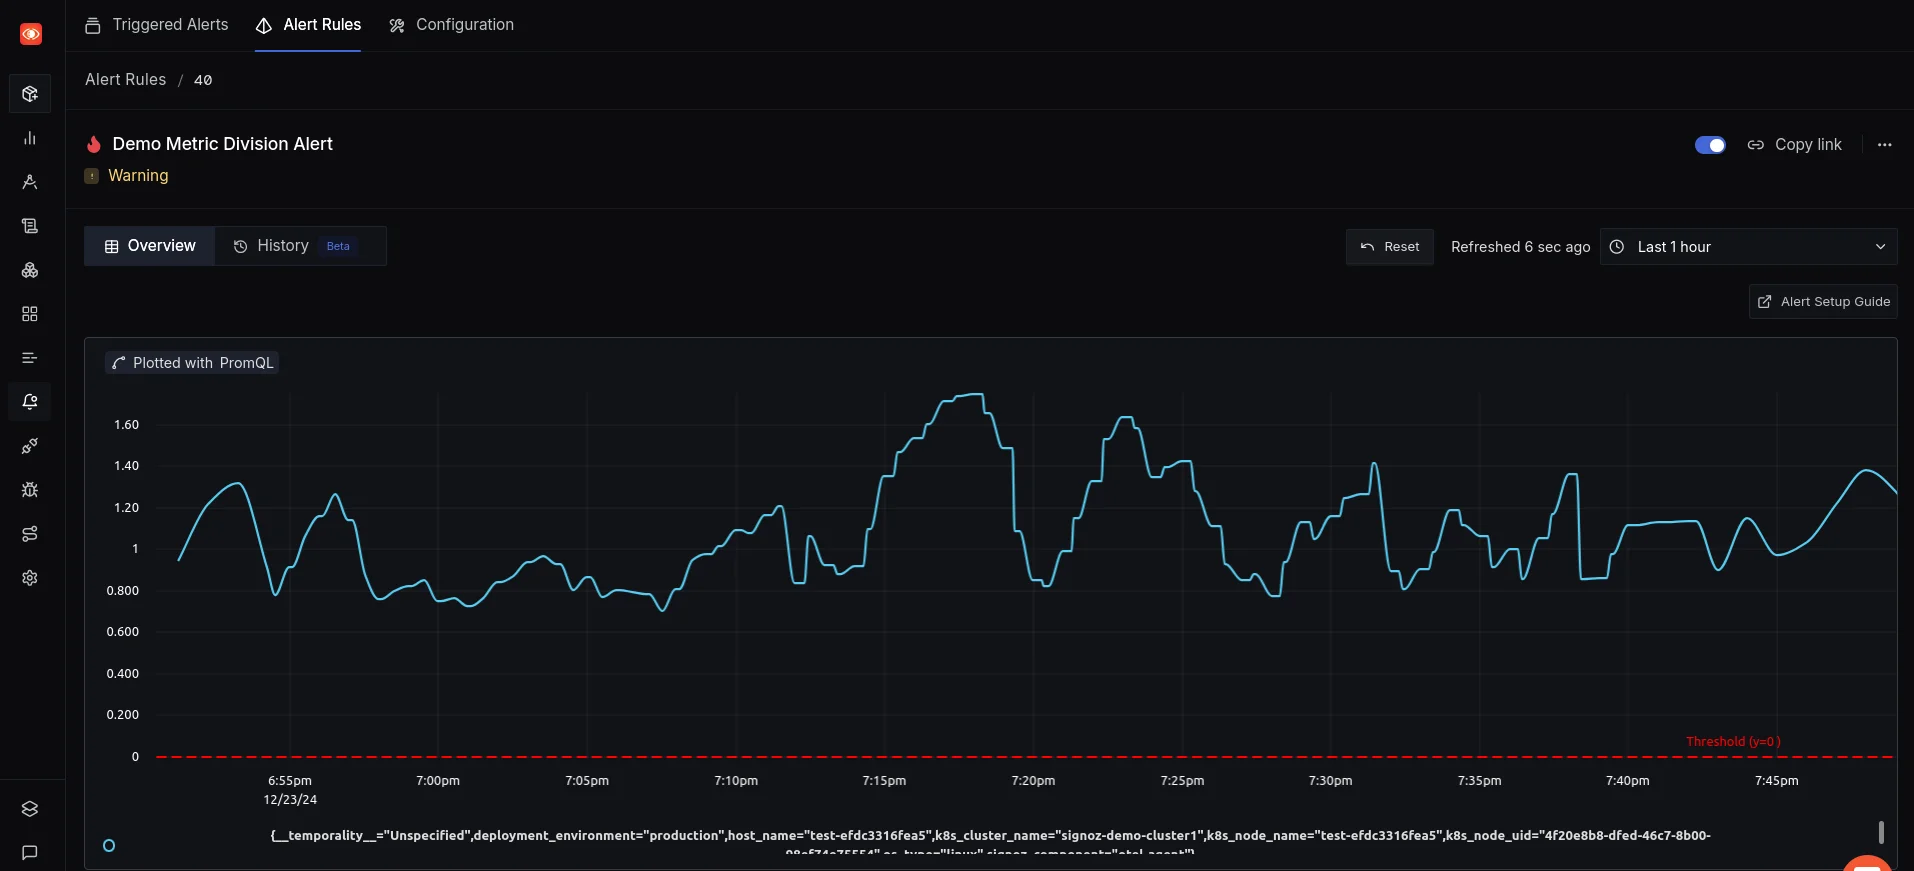
Custom Alerts Based on PromQL Queries for CPU Load Monitoring
SigNoz cloud is the easiest way to run SigNoz. Sign up for a free account and get 30 days of unlimited access to all features.
You can also install and self-host SigNoz yourself since it is open-source. With 19,000+ GitHub stars, open-source SigNoz is loved by developers. Find the instructions to self-host SigNoz.
Key Takeaways
- Metric division in Prometheus helps extract valuable insights from raw metrics.
- Accurate division relies on a solid understanding of PromQL and proper label alignment.
- Advanced techniques like subqueries and mathematical functions enhance division capabilities.
- Visualization and alerting based on divided metrics improve overall system observability.
- Tools like SigNoz can complement Prometheus for a more robust monitoring experience.
FAQs
What are some common pitfalls when dividing metrics in Prometheus?
Common pitfalls include mismatched labels, division by zero, and high cardinality. To avoid these issues:
- Ensure label consistency.
- Safeguard against zero values to prevent errors.
- Aggregate data when necessary to manage cardinality effectively.
How can I ensure my divided metrics are accurate and meaningful?
To maintain accuracy:
- Confirm that the metrics being divided are logically related.
- Ensure consistent units and scaling factors.
- Use
rate()orincrease()for counter metrics before performing division. - Cross-check results against baselines or alternative calculations.
Is it possible to divide metrics with different time intervals or resolutions?
Yes, you can divide metrics with different intervals using subqueries or by aligning the time ranges. For example:
rate(metric_a[5m]) / rate(metric_b[1h])
This divides the 5-minute rate of metric_a by the 1-hour rate of metric_b.
Can I use metric division for capacity planning and forecasting?
Absolutely. Metric division is valuable for capacity planning. You can:
- Calculate resource utilization trends over time.
- Project future needs based on historical growth rates.
- Determine efficiency metrics to optimize resource allocation.
For example, to forecast CPU needs, you might divide the rate of increase in CPU usage by the rate of increase in workload to estimate future requirements.

