Manage Panels
This section shows how you can create, update, and remove a panel.
Prerequisites
- This section assumes that your application is already instrumented. For details about how you can instrument your application, see the Instrument Your Application section.
- This section assumes that you are familiar with the basics of monitoring applications.
Steps to Add a Panel to a Dashboard
SigNoz supports two types of panels: time series, which displays a metric over a time interval, and value, which displays only the most recent value. To add a panel to a dashboard, follow the steps below:
- From the sidebar, choose Dashboards.
- Find the dashboard to which you want to add a new panel.
- Select Add Panel.
- Select either Time Series or Value.
- Populate the following fields:
- Panel Title: Enter a descriptive name for your panel.
- Description: Enter a brief and meaningful description of your new panel.
- (Optional) Panel Time Preference: You can use the the drop-down list to specify the time range for which you want to view data. The time range you specify here overrides the global value.
- (Optional) Y Axis Unit: Specify the unit of measurement for the y-axis.
- To specify the data displayed on your panel, you can use:
- The query builder. The query builder provides an easy-to-use graphical interface that allows you create custom queries. For instructions, see the Create a Custom Query page.
- The declarative query language based on SQL that ClickHouse supports. For details, see the SQL Reference page of the ClickHouse documentation.
- PromQL. For details see the Prometheus Querying Language page of the Prometheus documentation.
- (Optional) If you’re using the query builder, you can also transform your data by adding mathematical functions. For example, you can divide the value that a query returns by a number. The following mathematical functions are supported: exp, log, ln, exp2, log2, exp10, log10, sqrt, cbrt, erf, erfc, lgamma, tgamma, sin, cos, tan, asin, acos, atan, degrees, radians.
- (Optional) The result of the panel query returns a timestamp, float value, and optional set of attributes. The attributes from the response can be used in legend formatting.
- (Optional) You can plot up to ten queries on the same panel. To plot a new query, select the + Query button.
- When you’ve finished, select the Save button.
Note the following about panels:
- The total number of queries and functions you can plot on a single panel must be less or equal to ten.
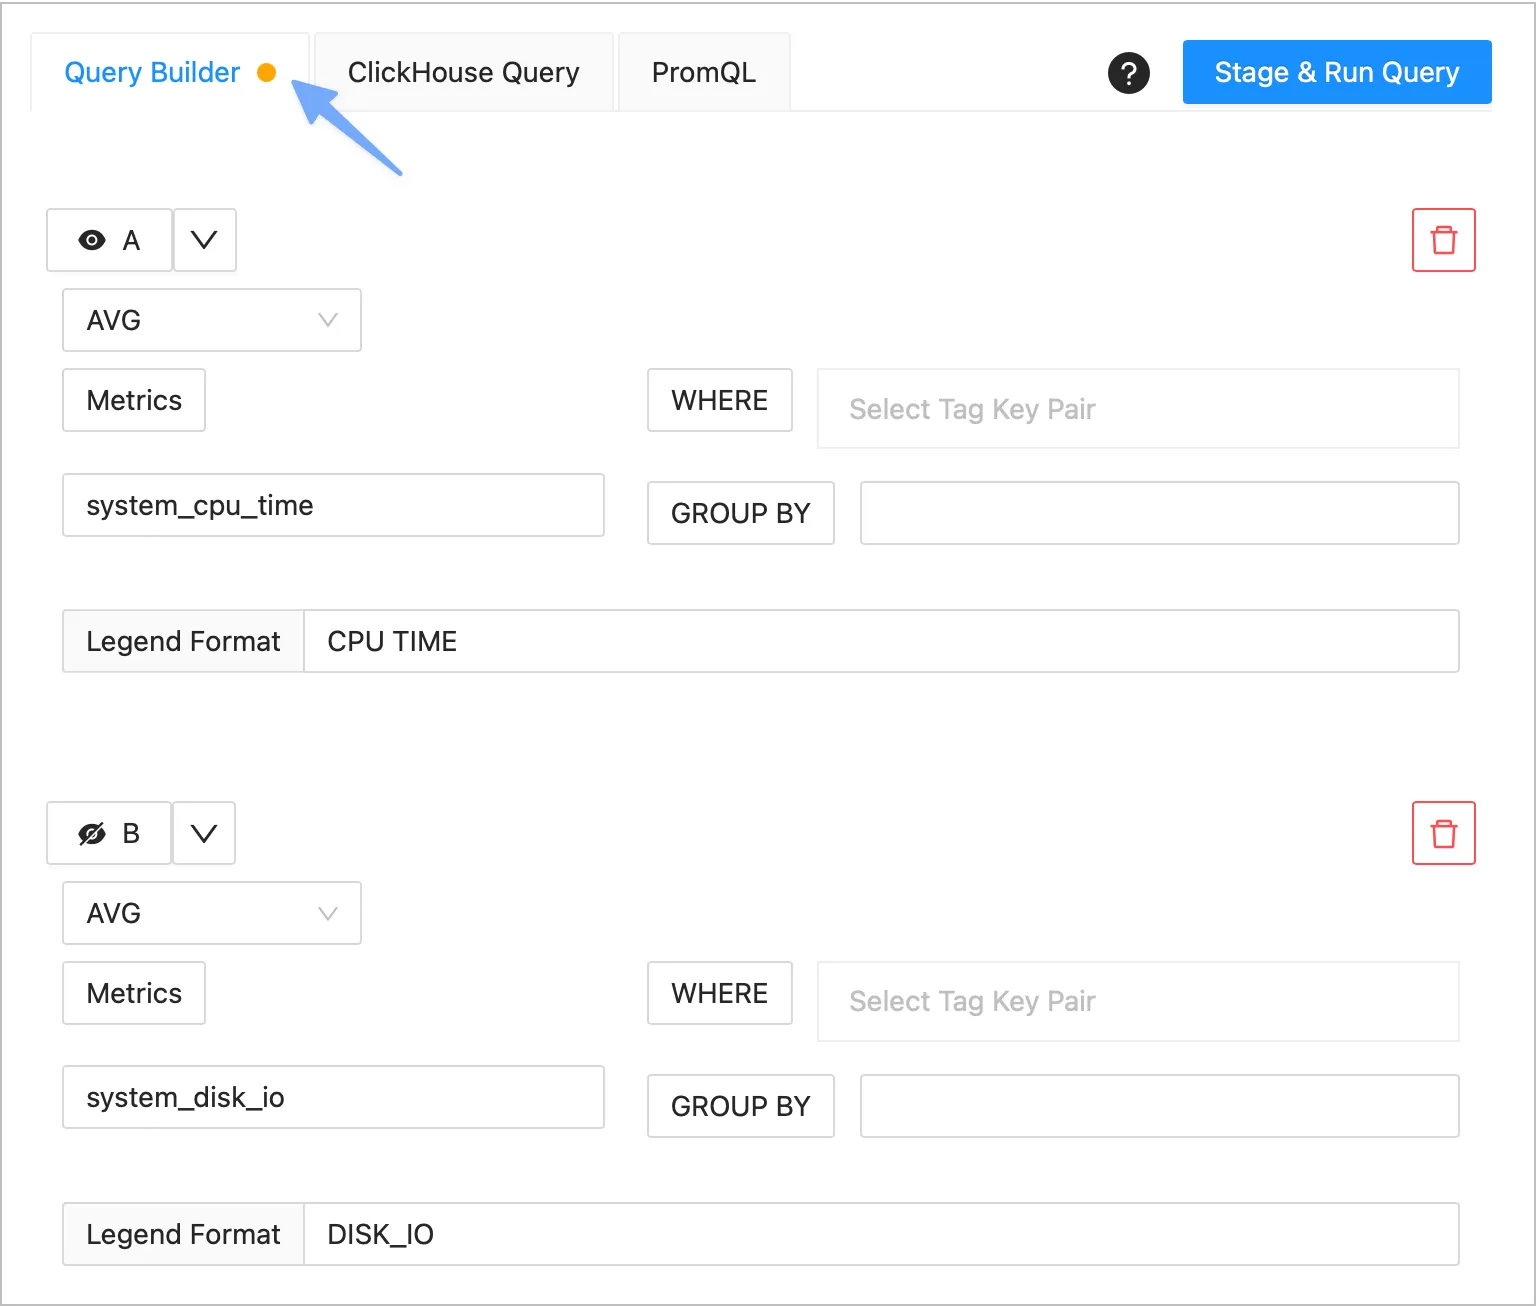
- Every time you add or modify a function or formula, you must select the Stage & Run Query button. If you do not select this button, the panel will not be updated and your changes will be lost whenever you move to a different tab. When you have unsaved changes, the system will display an orange circle next to the name of the tab that you've modified:

- You can hide or unhide a function or formula by selecting the eye icon at its left and then selecting the Stage & Run Query button.
- When you install SigNoz, only the data provided by the Hostmetric receiver is available. To enable more metric receivers, see the Send Metrics to SigNoz section.
Steps to Update a Panel
- From the sidebar, choose Dashboard.
- Find the dashboard in which you created the panel you wish to update, and then select the pencil icon located at the top right corner of your panel.
- Make the changes.
- When you’ve finished, select the Save button.
Get Help
If you need help with the steps in this topic, please reach out to us on SigNoz Community Slack.
If you are a SigNoz Cloud user, please use in product chat support located at the bottom right corner of your SigNoz instance or contact us at [email protected].
