Send logs from Node.js Pino without requiring Otel collectors to SigNoz Cloud and Self-hosted
Overview
This document explains how to configure Pino to stream Node.js application logs directly to your SigNoz dashboard.
Step 1. Install the necessary packages:
npm i pino-opentelemetry-transport
Step 2. Configure Pino Logger
Create a logger configuration file (e.g., logger.js) in the root or a suitable directory (such as utils or config) of your application. This file will define a reusable logger setup for logging important information, errors, and debug details across your application. You can then import this file wherever logging is needed to maintain consistency and reduce redundancy.
const pino = require('pino');

const transport = pino.transport({
  target: 'pino-opentelemetry-transport'
});

const logger = pino(transport);

logger.info('Hello, World! from pino');
Step 2. Run Your Application
Execute your application with OpenTelemetry Environment variables:
OTEL_EXPORTER_OTLP_HEADERS="signoz-ingestion-key=<your-ingestion-key>" OTEL_EXPORTER_OTLP_LOGS_ENDPOINT=https://ingest.<region>.signoz.cloud:443/v1/logs OTEL_RESOURCE_ATTRIBUTES="service.name=<service_name>,service.version=1.2.3" node app.js
- Set the
<region>to match your SigNoz Cloud region - Replace
<your-ingestion-key>with your SigNoz ingestion key <service_name>is name of your service
Usage Examples
The below examples show how to log messages with different severity levels and include structured metadata that can be used for filtering and analysis in SigNoz.
Basic Logging
logger.info('Hello, World! from pino');
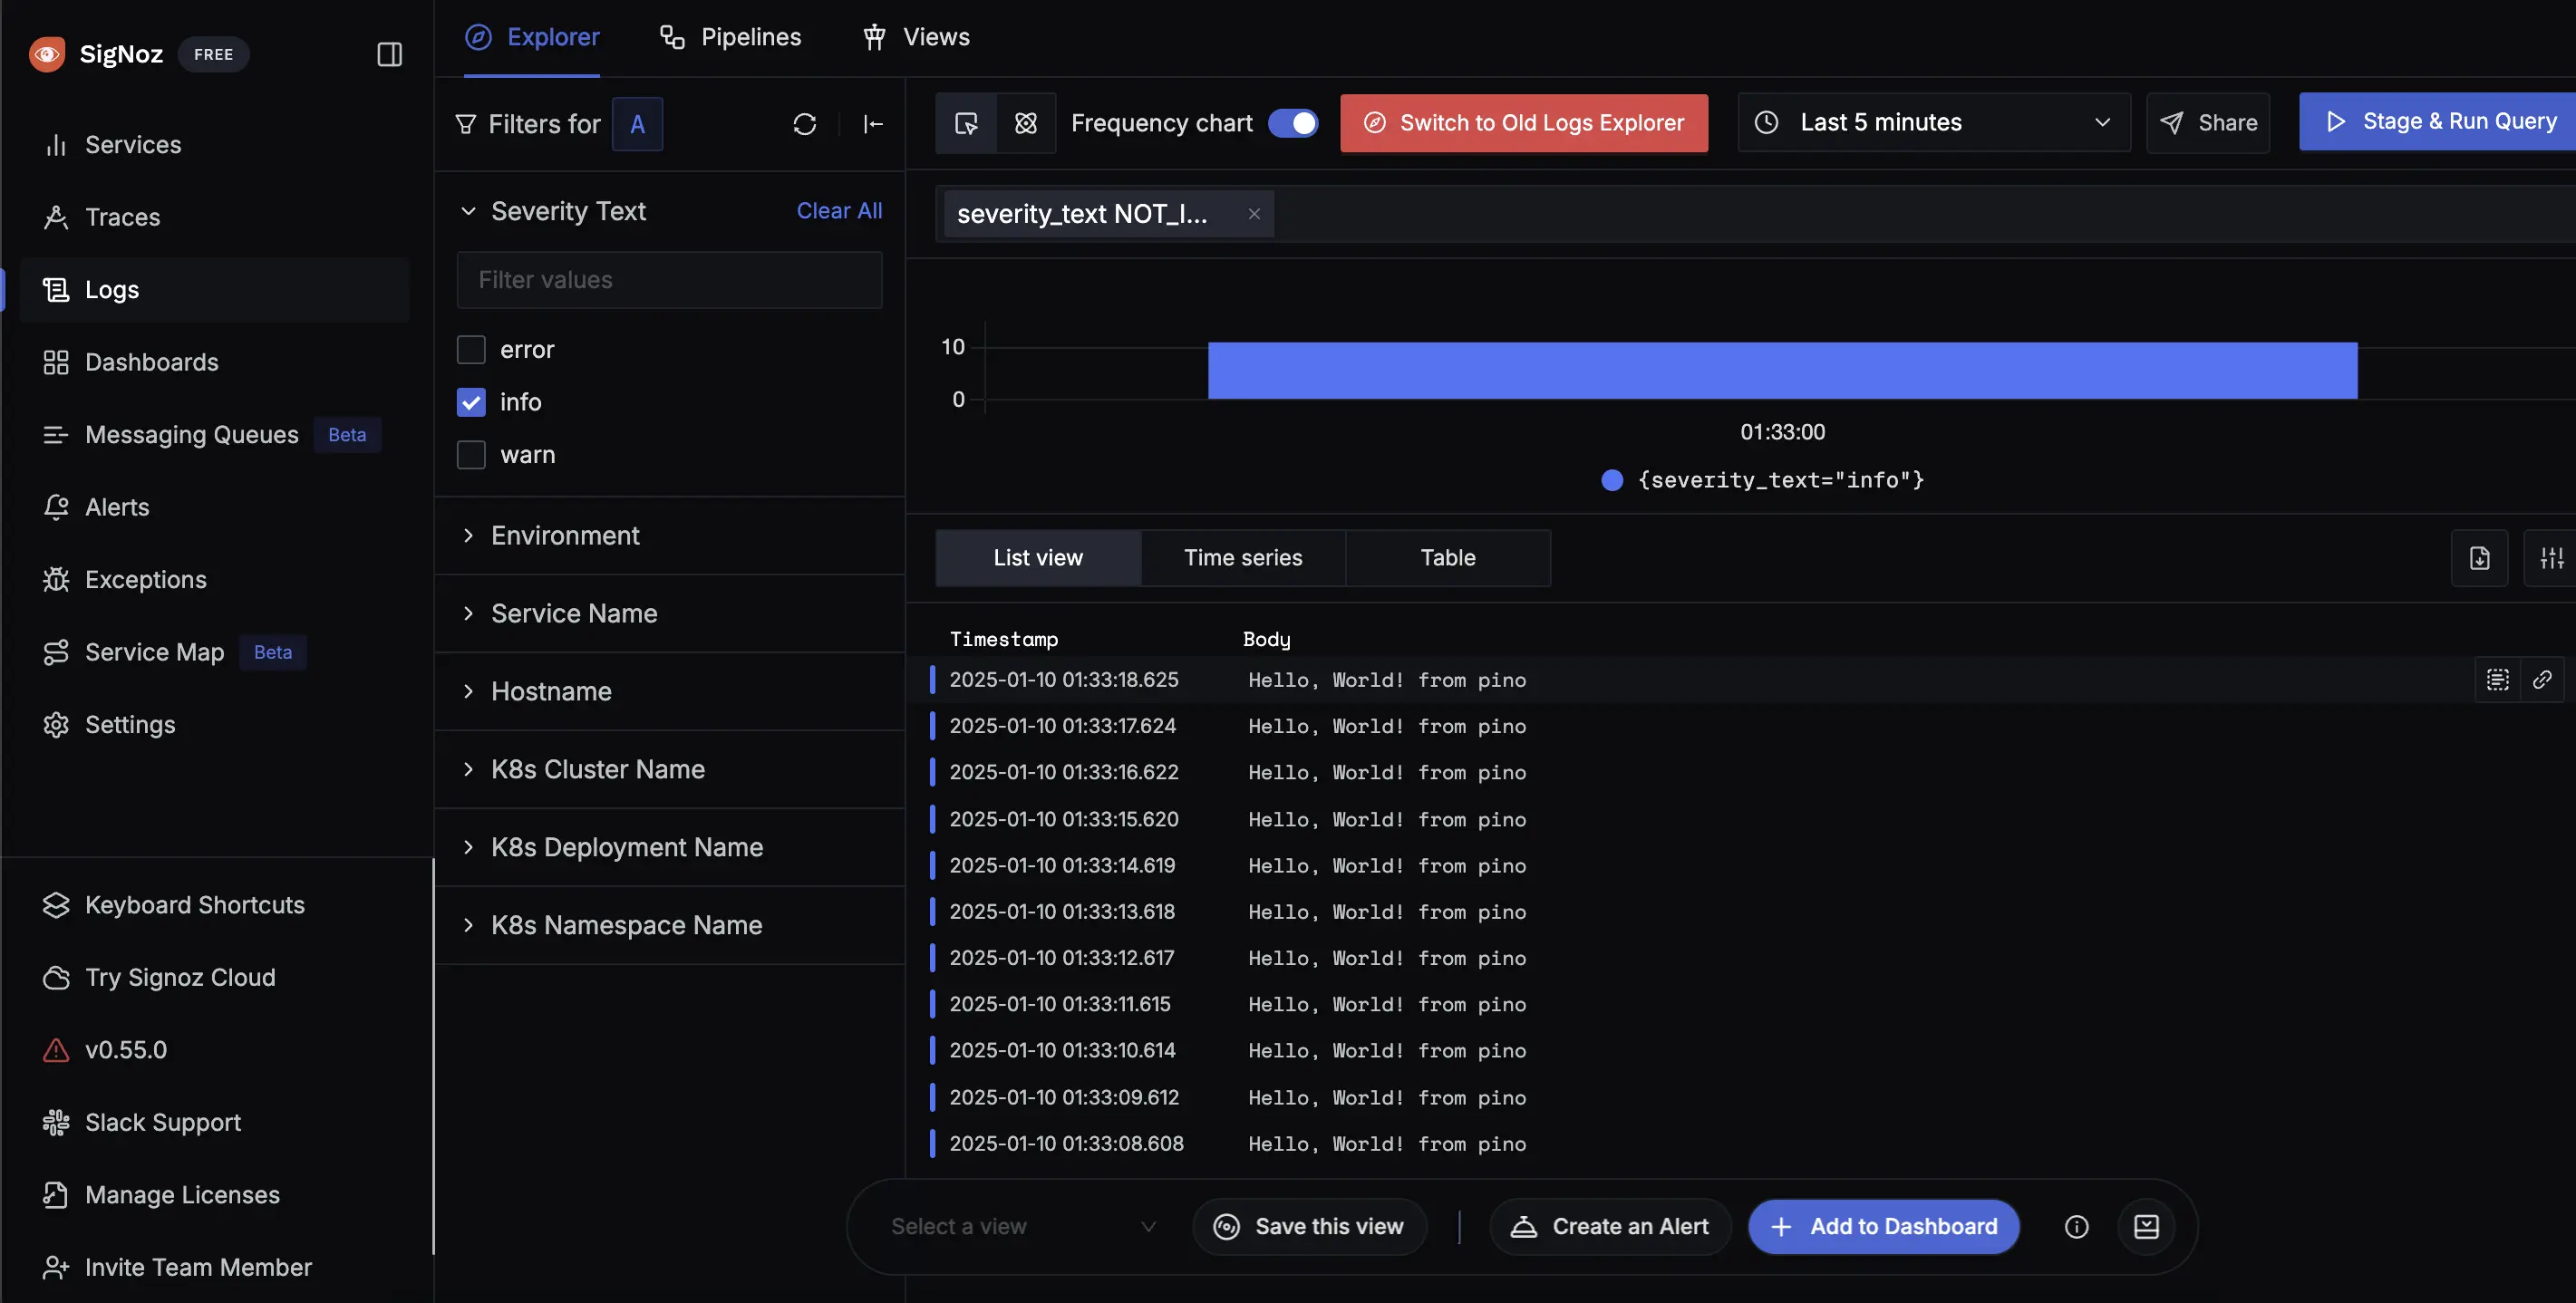
Severity Level: INFO
logger.warn('High memory usage detected');
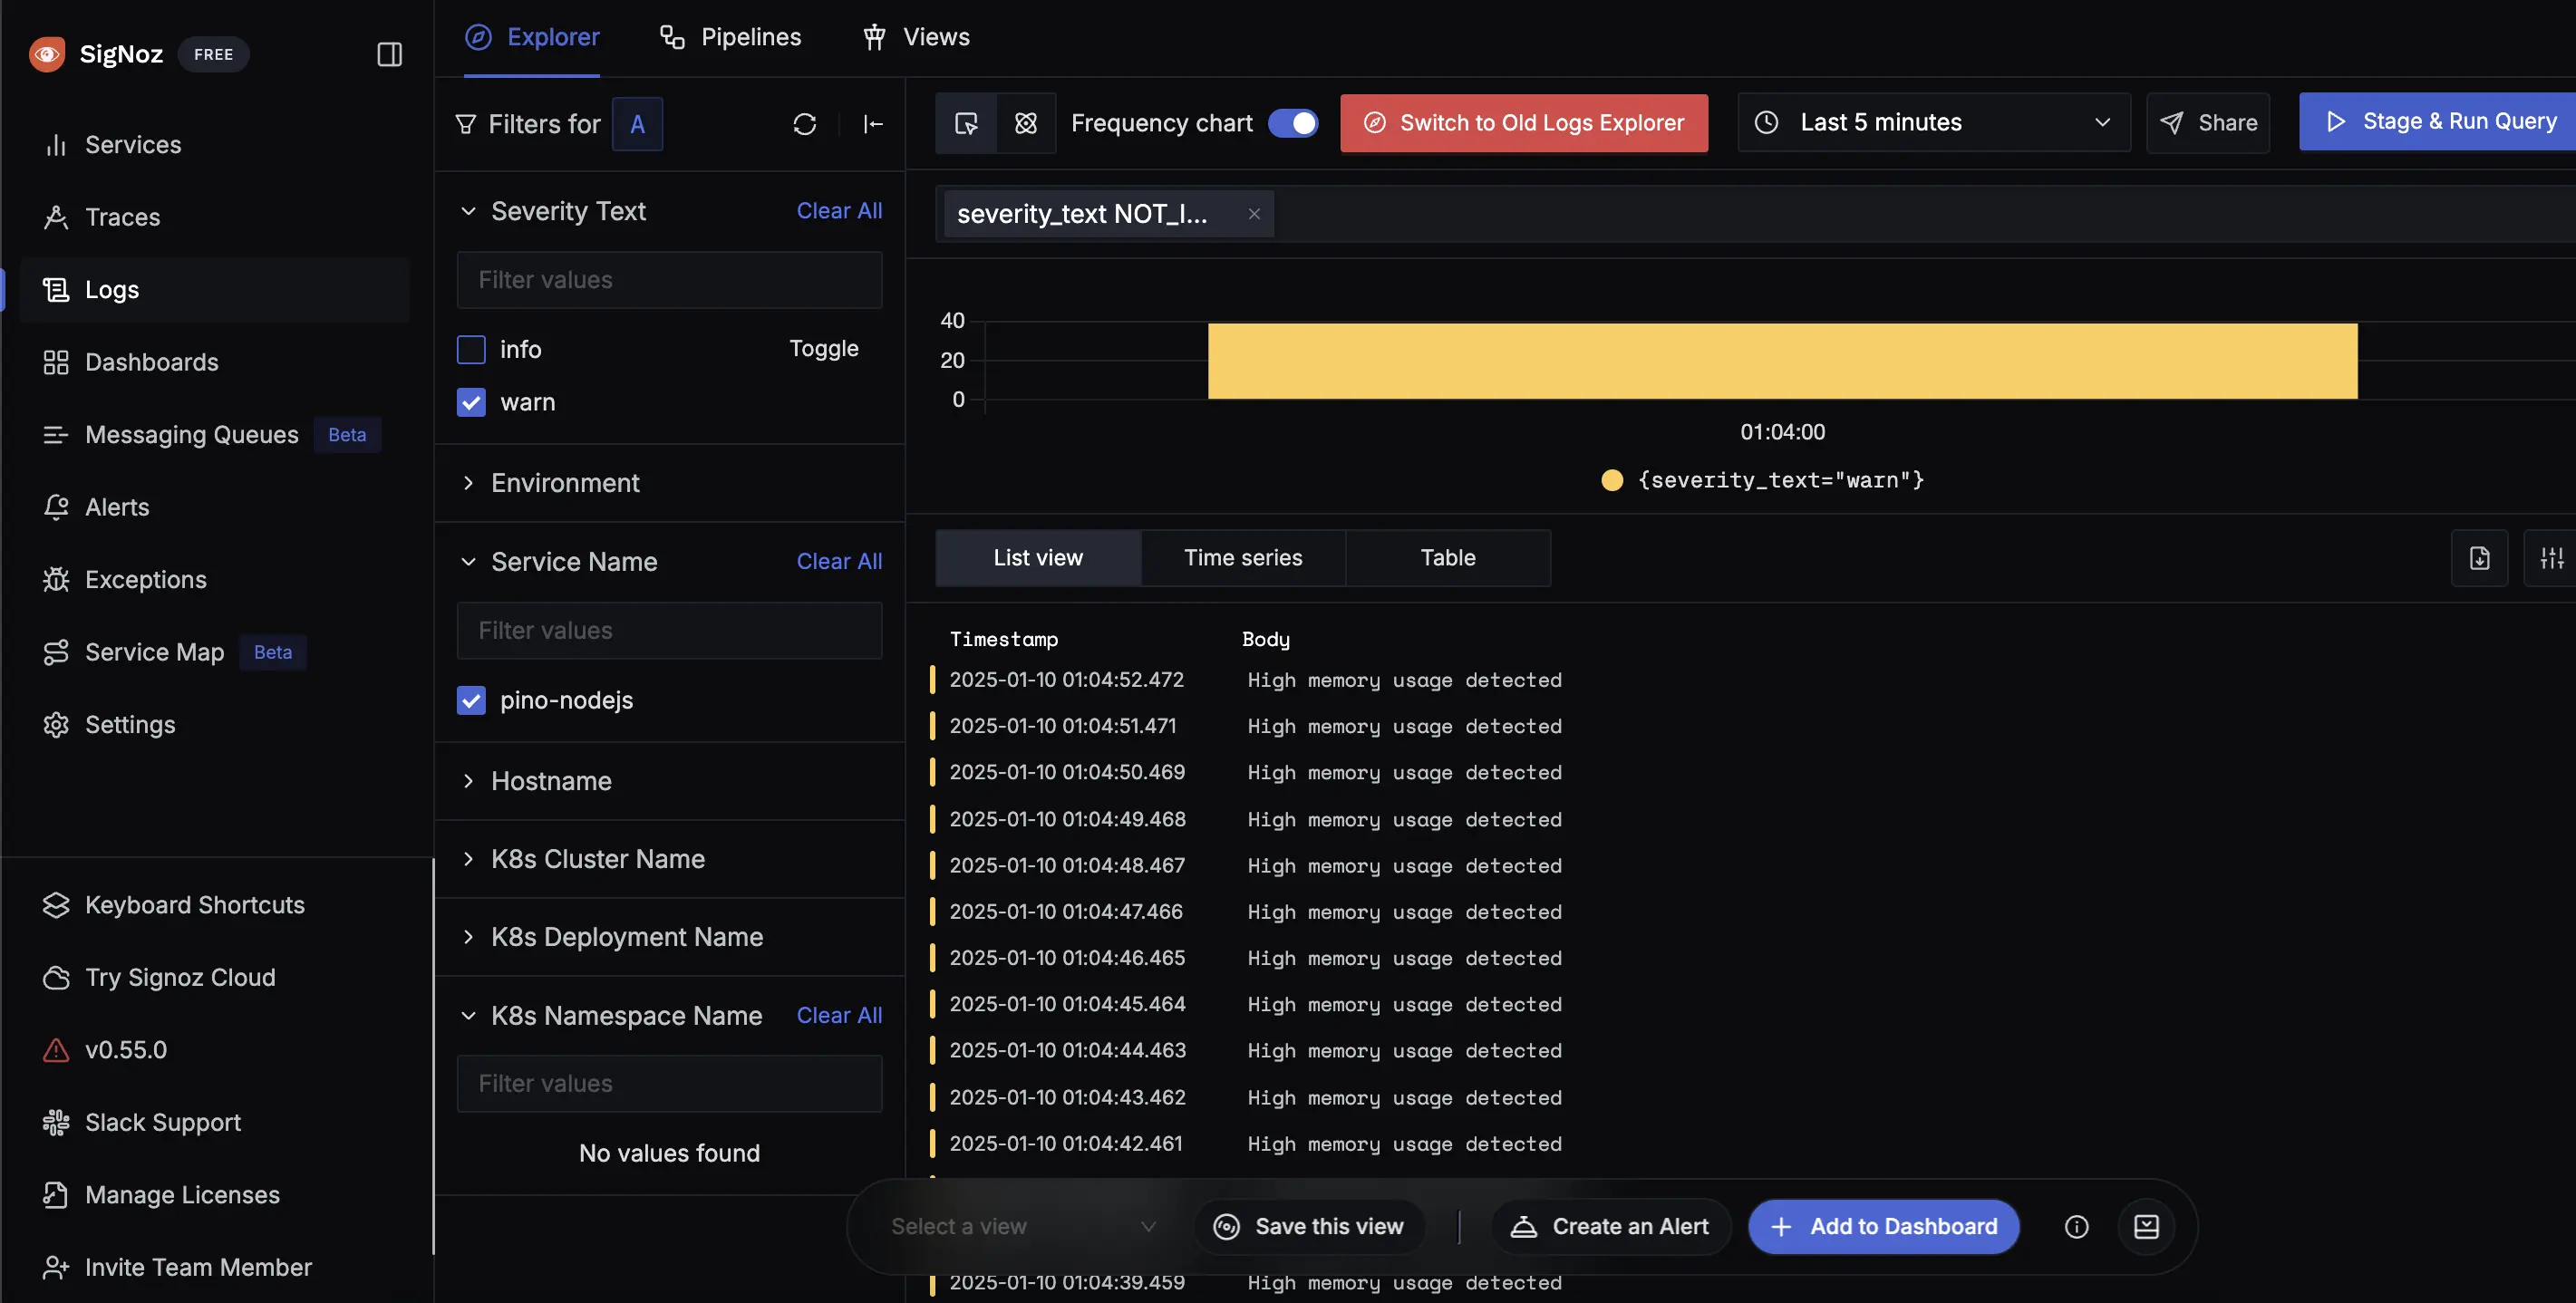
Severity Level: WARN
logger.error('Failed to process request');
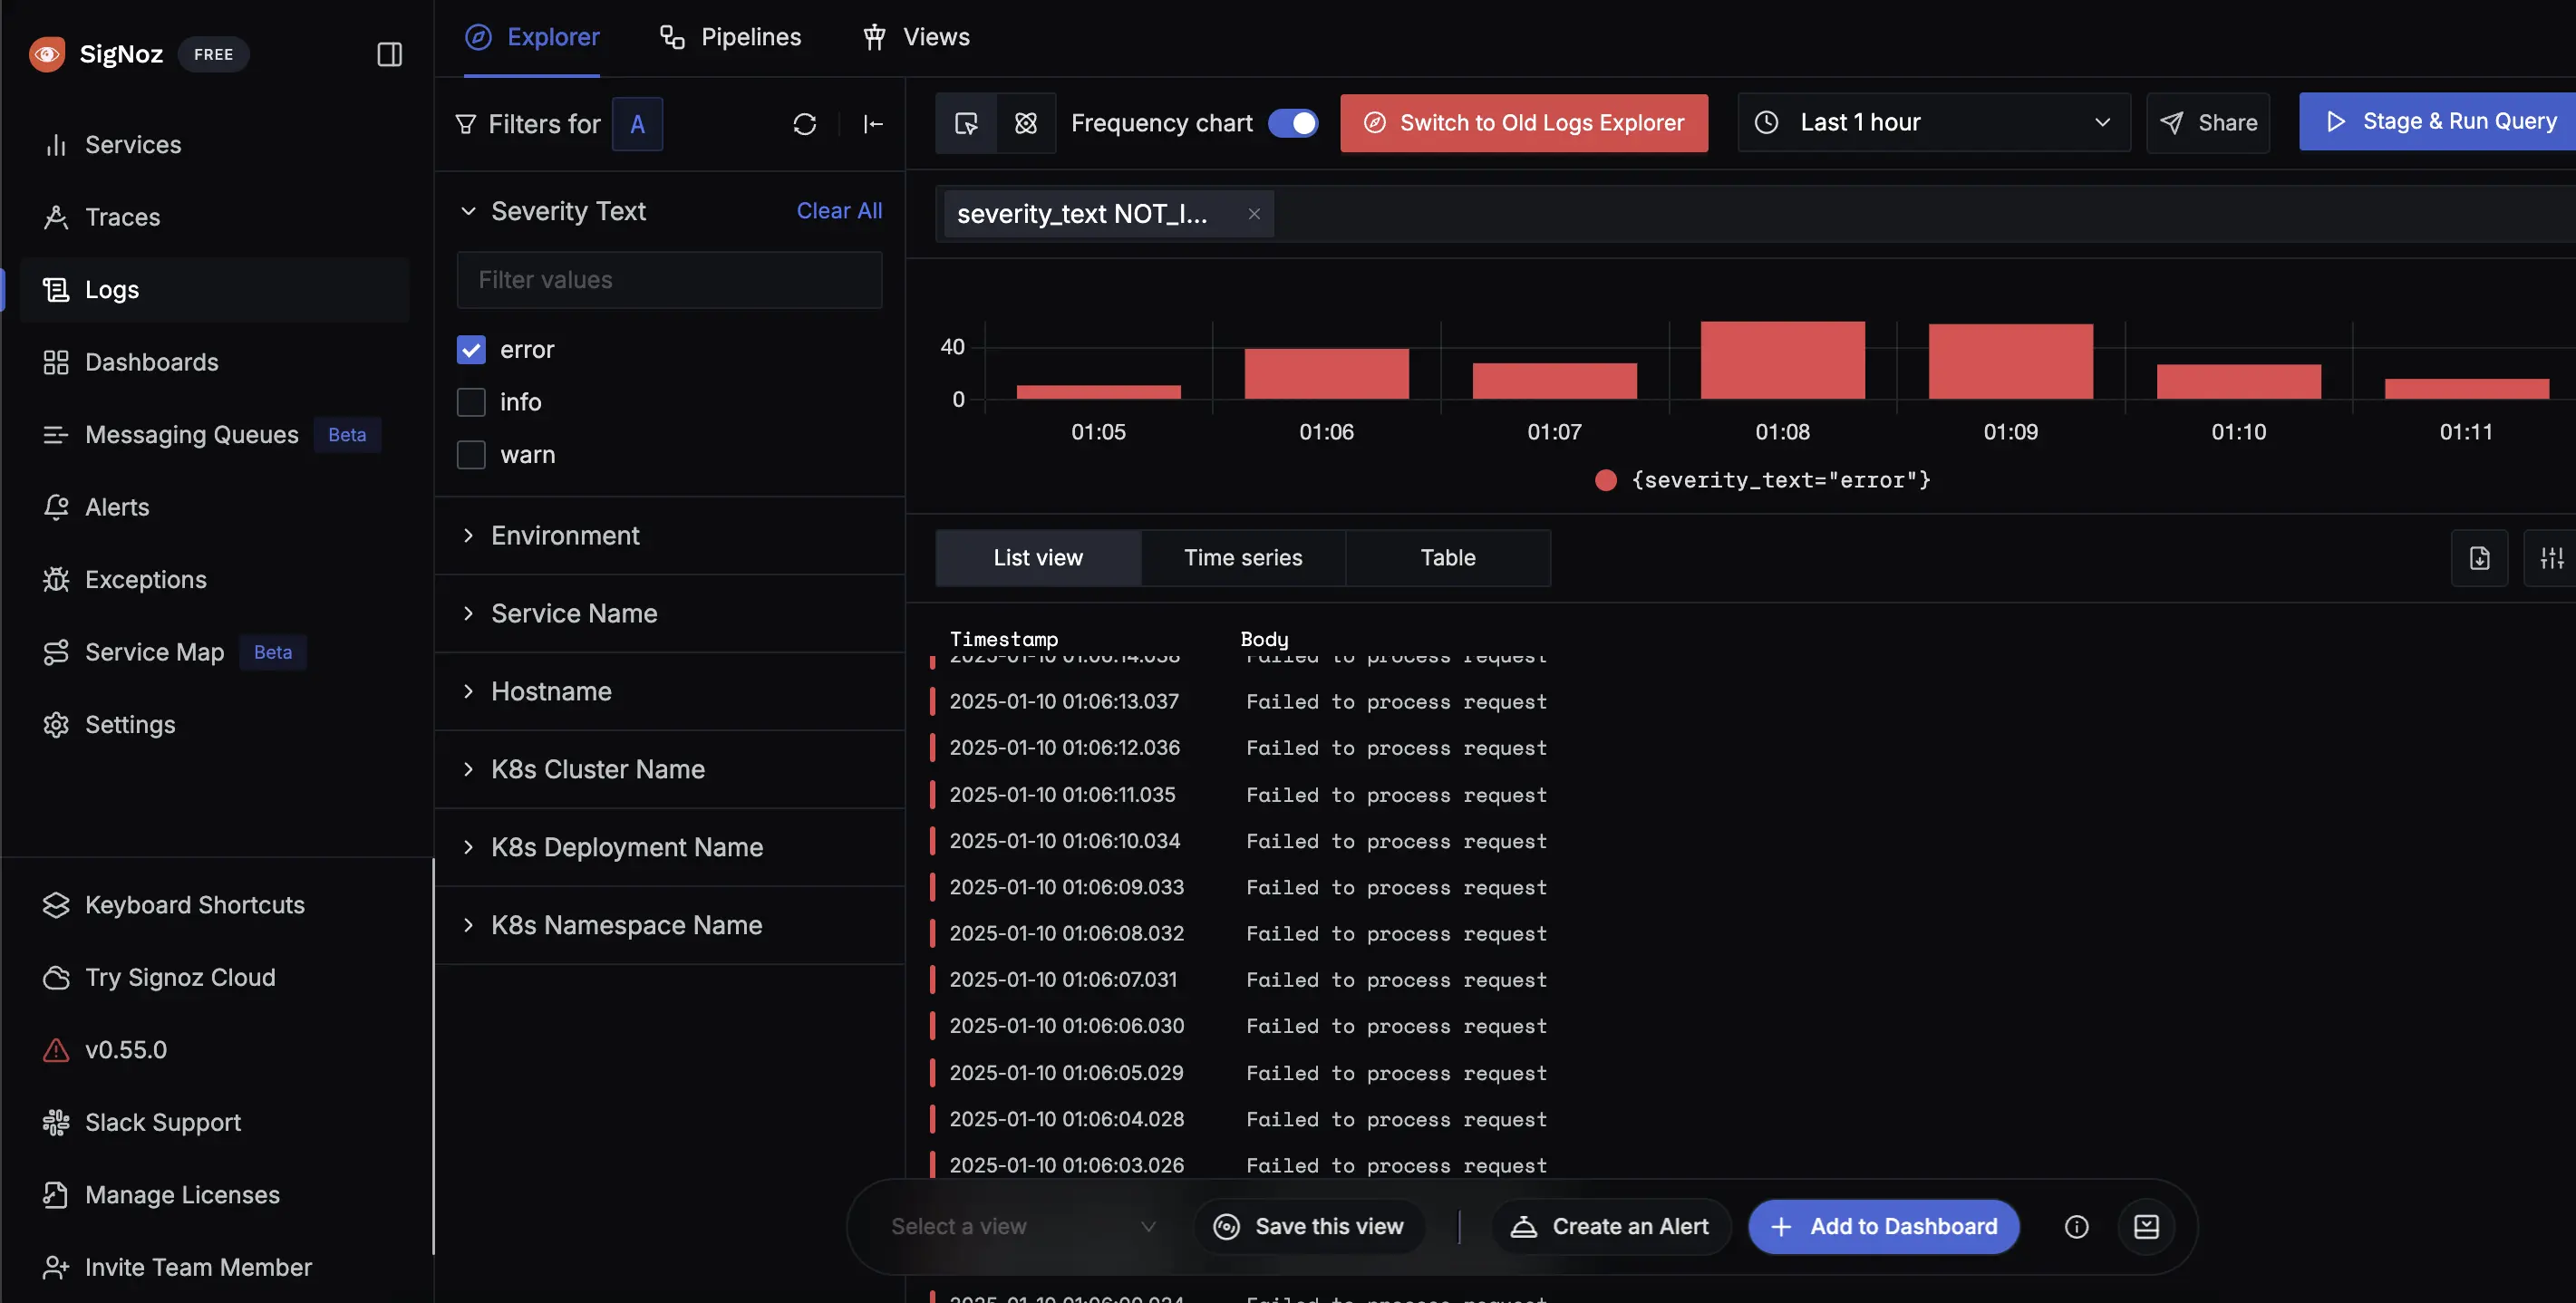
Severity Level: ERROR
logger.error({
    msg: 'Error occurred',
    error: error.message,
    stack: error.stack
});
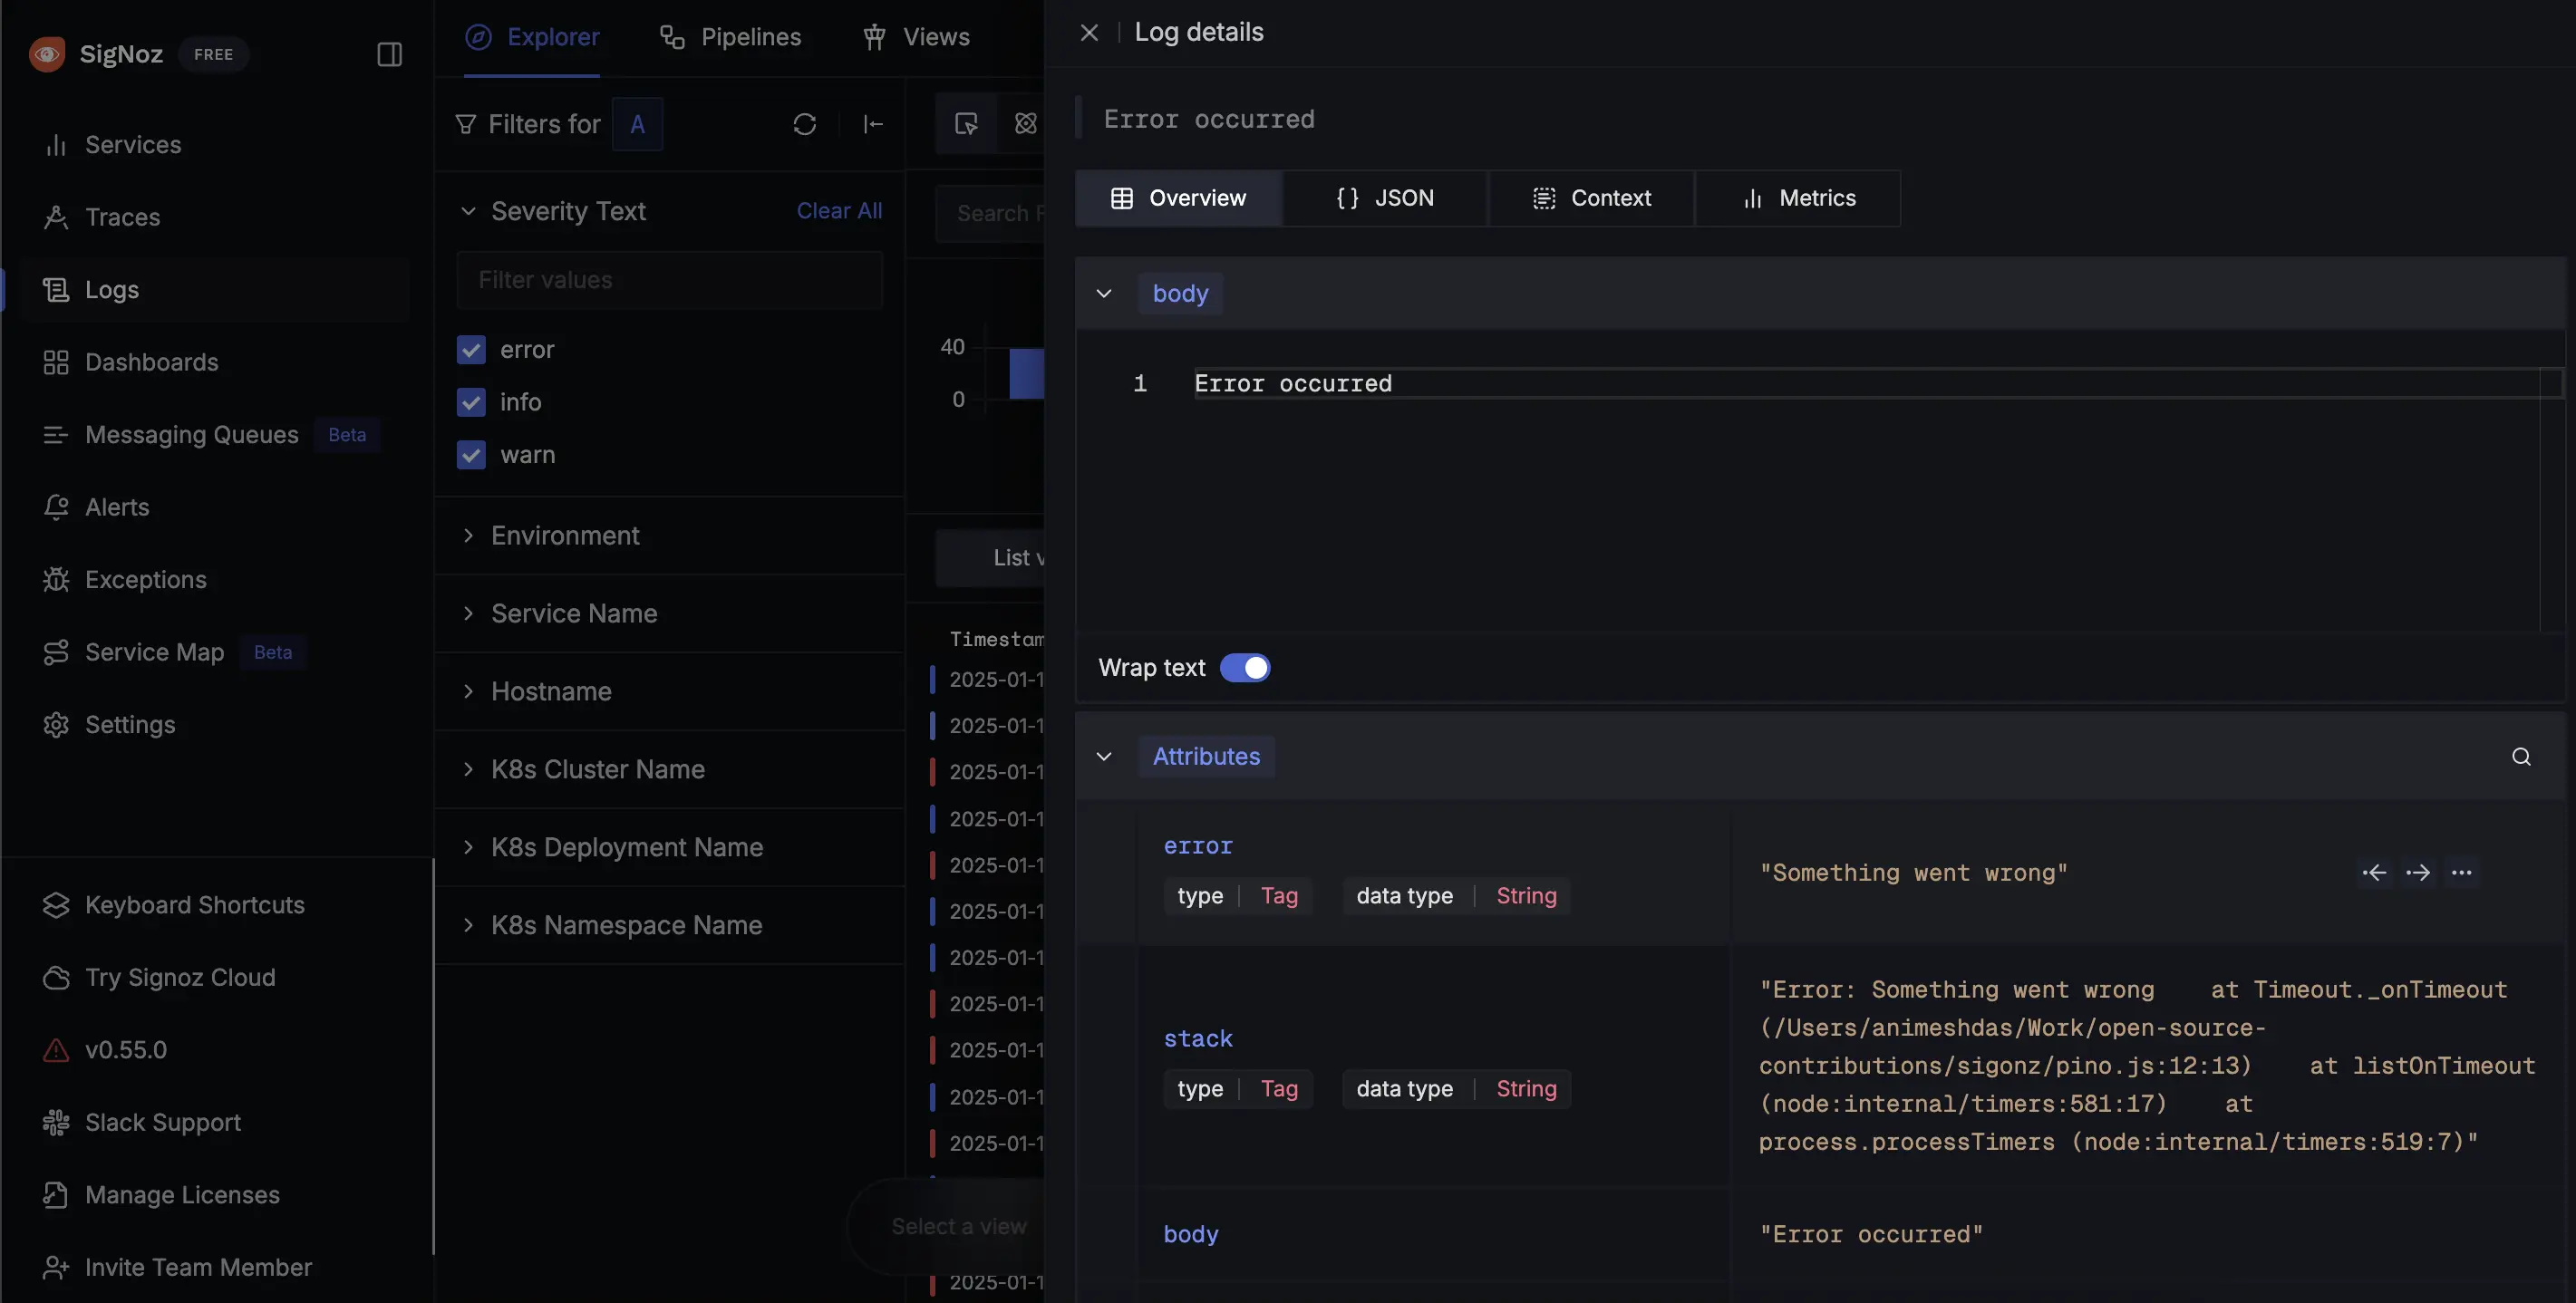
Severity Level: ERROR
Output
After successful implementation, your logs will appear in your SigNoz Logs section where you can:
- Monitor logs in real-time
- Filter logs by level and custom attributes
- Search through log contents
- Create alerts based on log patterns
- Visualize log trends and patterns
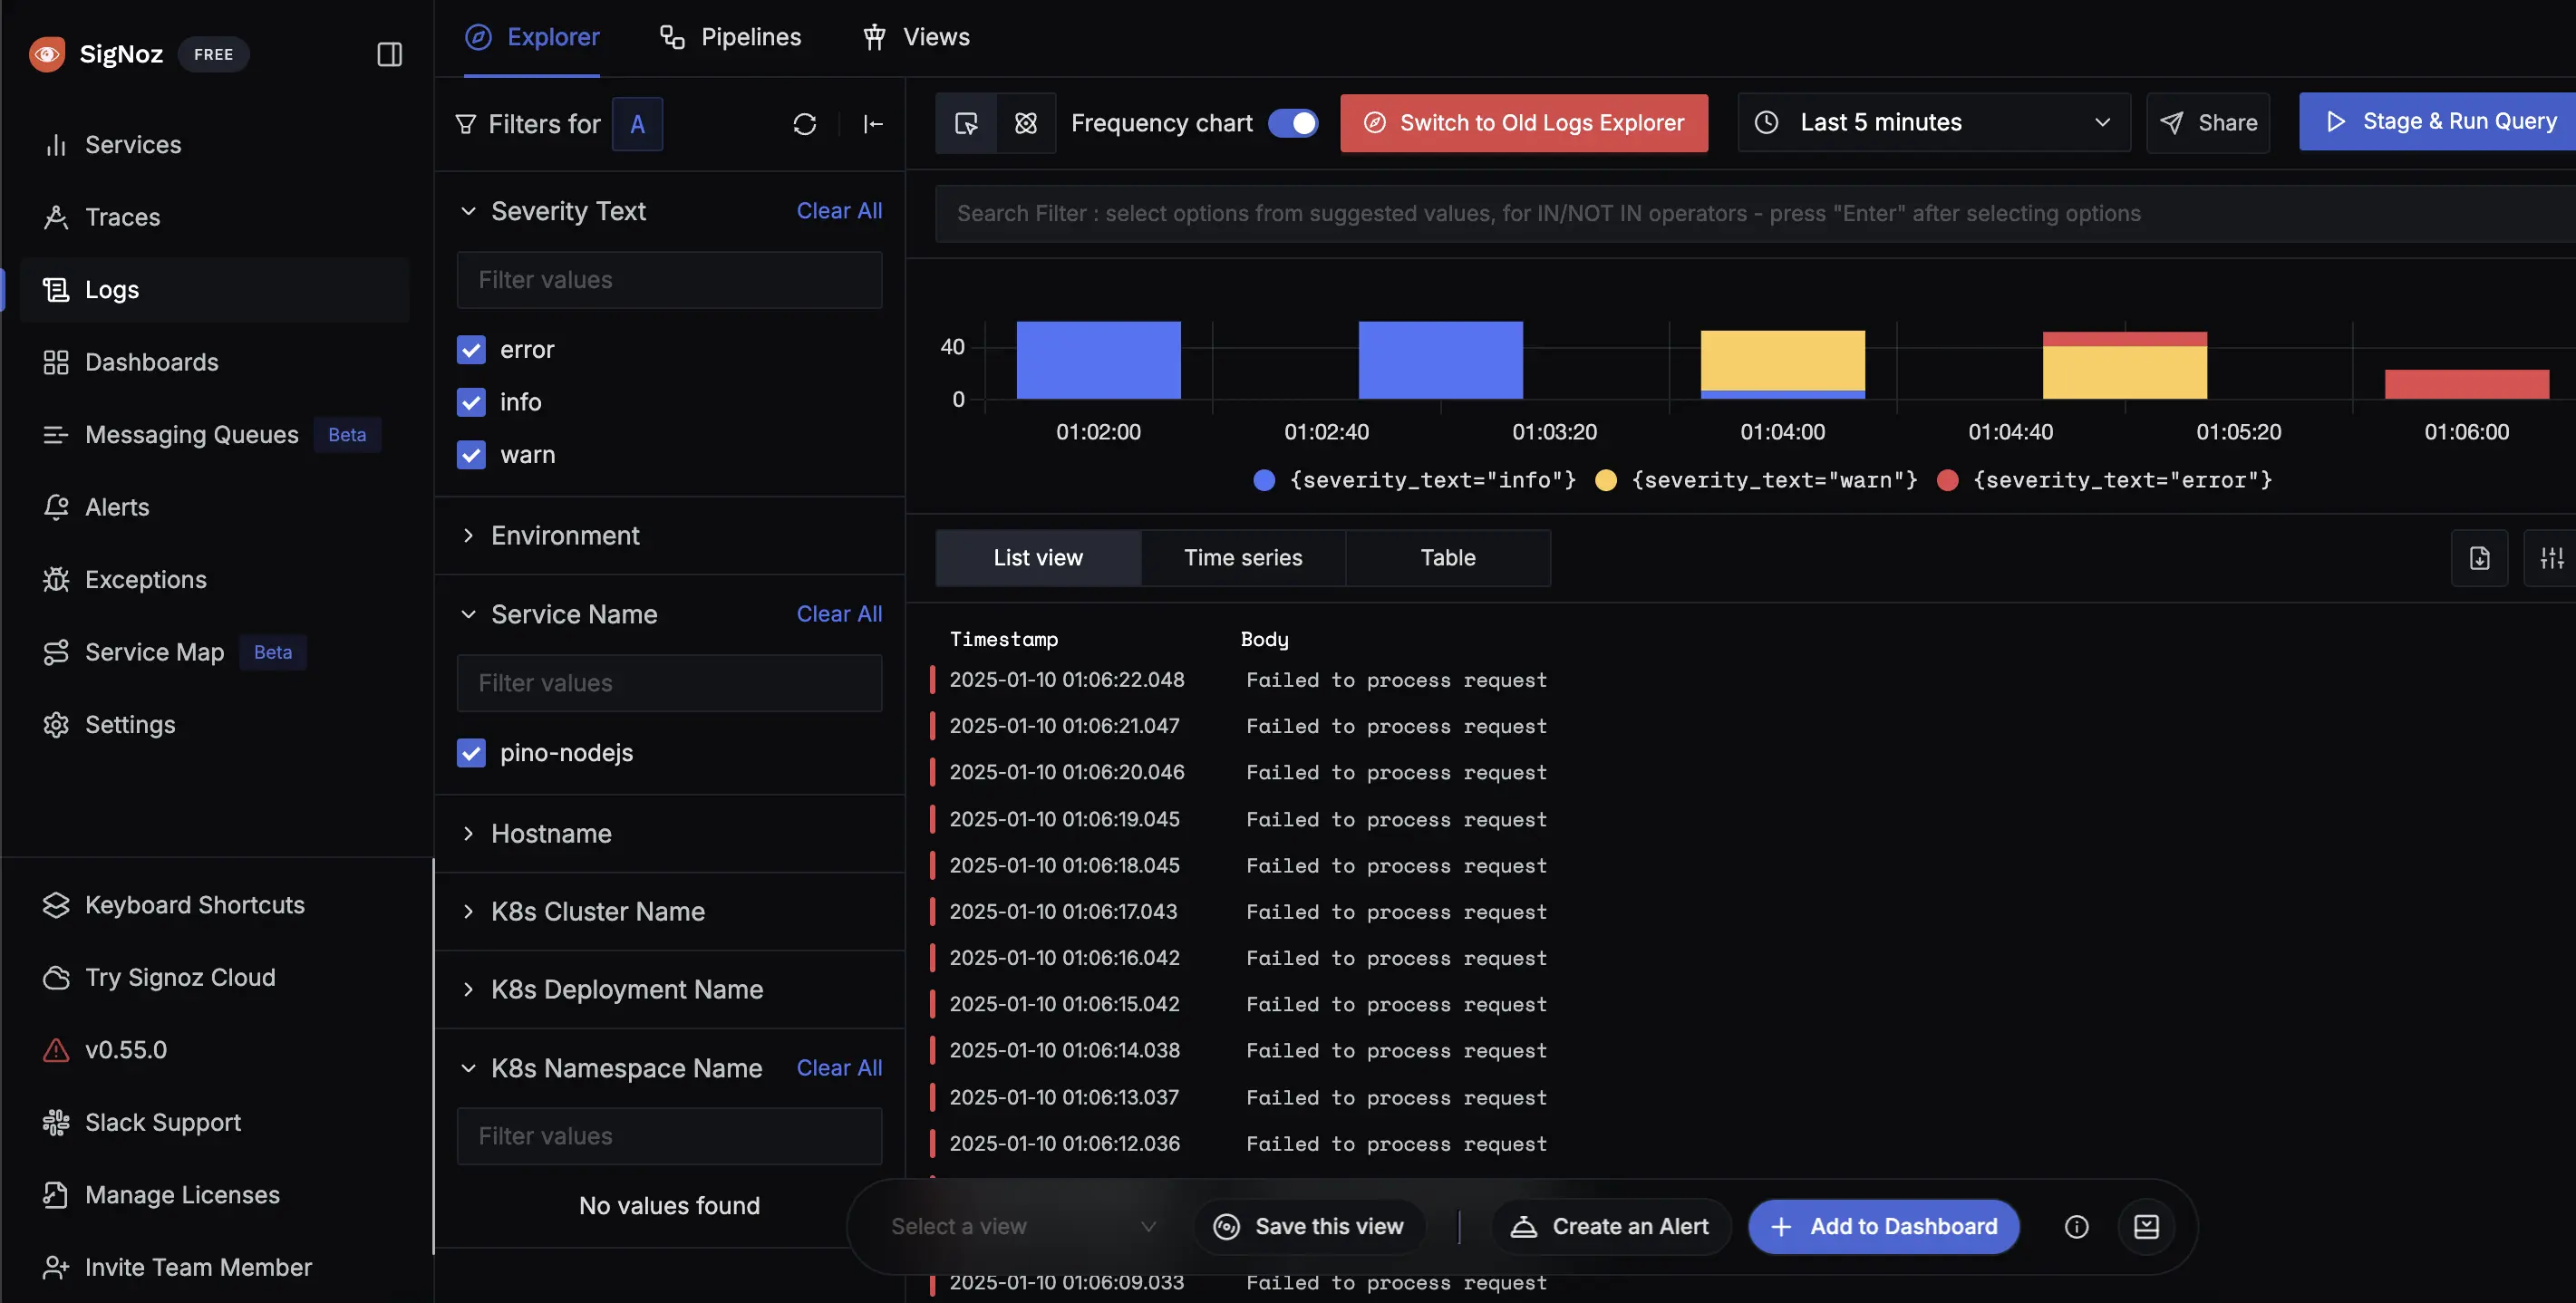
Node.js Pino Logs in SigNoz
Troubleshooting
If logs are not appearing in SigNoz:
- Verify your Ingestion Keys and endpoint URL
- Ensure the transport is properly configured
- Review SigNoz Logs Section filters
- Check Pino log level settings
