Document Load
Overview
This documentation explains how to auto-instrument your web application to collect document load data, visualize it as traces in SigNoz, and set useful alerts.
Using OpenTelemetry to capture data on document load is useful because it allows you to monitor your application's key performance metrics. This data is essential for:
- Page Load Sequence: Traces give you insight into the sequence of operations during document load, helping identify slow resources or inefficient processes that may delay rendering.
- Content Delivery: By understanding where delays occur (such as in external resource fetches or script execution), you can take specific actions to improve how content is delivered to users.
- Slow Resources: Trace data reveals third-party services or external APIs that may cause slowdowns, enabling decisions to cache, optimize, or delay the loading of those resources.
- Proactive Monitoring: Continuously tracking document load traces helps identify bottlenecks before they affect a large portion of users, allowing for preemptive performance tuning.
- Latency Causes: Pinpointing delays in content load allow for targeted optimizations, whether caused by large assets, server issues, or inefficient scripts.
Prerequisites
- A Web Application for capturing document load data
Setup
Step 1: Create an Instrumentation file
In the src directory of your web application, create a new JavaScript file (e.g., otel-setup.js) and paste the code below. This code auto-instruments your application to capture and send document load events to your SigNoz Instance.
import { WebTracerProvider } from '@opentelemetry/sdk-trace-web';
import { DocumentLoadInstrumentation } from '@opentelemetry/instrumentation-document-load';
import { registerInstrumentations } from '@opentelemetry/instrumentation';
import { OTLPTraceExporter } from '@opentelemetry/exporter-trace-otlp-http';
import { SimpleSpanProcessor } from '@opentelemetry/sdk-trace-base';
import { Resource } from '@opentelemetry/resources';

// Initialize the provider
const provider = new WebTracerProvider({ resource: new Resource({ "service.name": "<service_name>" }) // Set the SigNoz Cloud collector URL

// create an OTLP exporter configured to send trace data to your SigNoz Cloud
const otlpExporter = new OTLPTraceExporter({
  url: `https://ingest.<region>.signoz.cloud:443/v1/traces`,
  headers: { 'signoz-access-token': "<your-ingestion-key>" });

// Add the exporter to the span processor
provider.addSpanProcessor(new SimpleSpanProcessor(otlpExporter));

// Register the provider
provider.register();

// Register automatic instrumentation for document load
registerInstrumentations({
  instrumentations: [
    new DocumentLoadInstrumentation()
  ],
});

console.log('OpenTelemetry instrumentation initialized');
- Set the
<region>to match your SigNoz Cloud region - Replace
<your-ingestion-key>with your SigNoz ingestion key <service_name>is name of your service
Step 2: Send Telemetry data to SigNoz
To send Telemetry data to SigNoz, import otel-setup.js into index.js and save the changes.
import './otel-setup'
Step 3: Start the App
Go to the root folder of your web application, and run the following command:
npm start
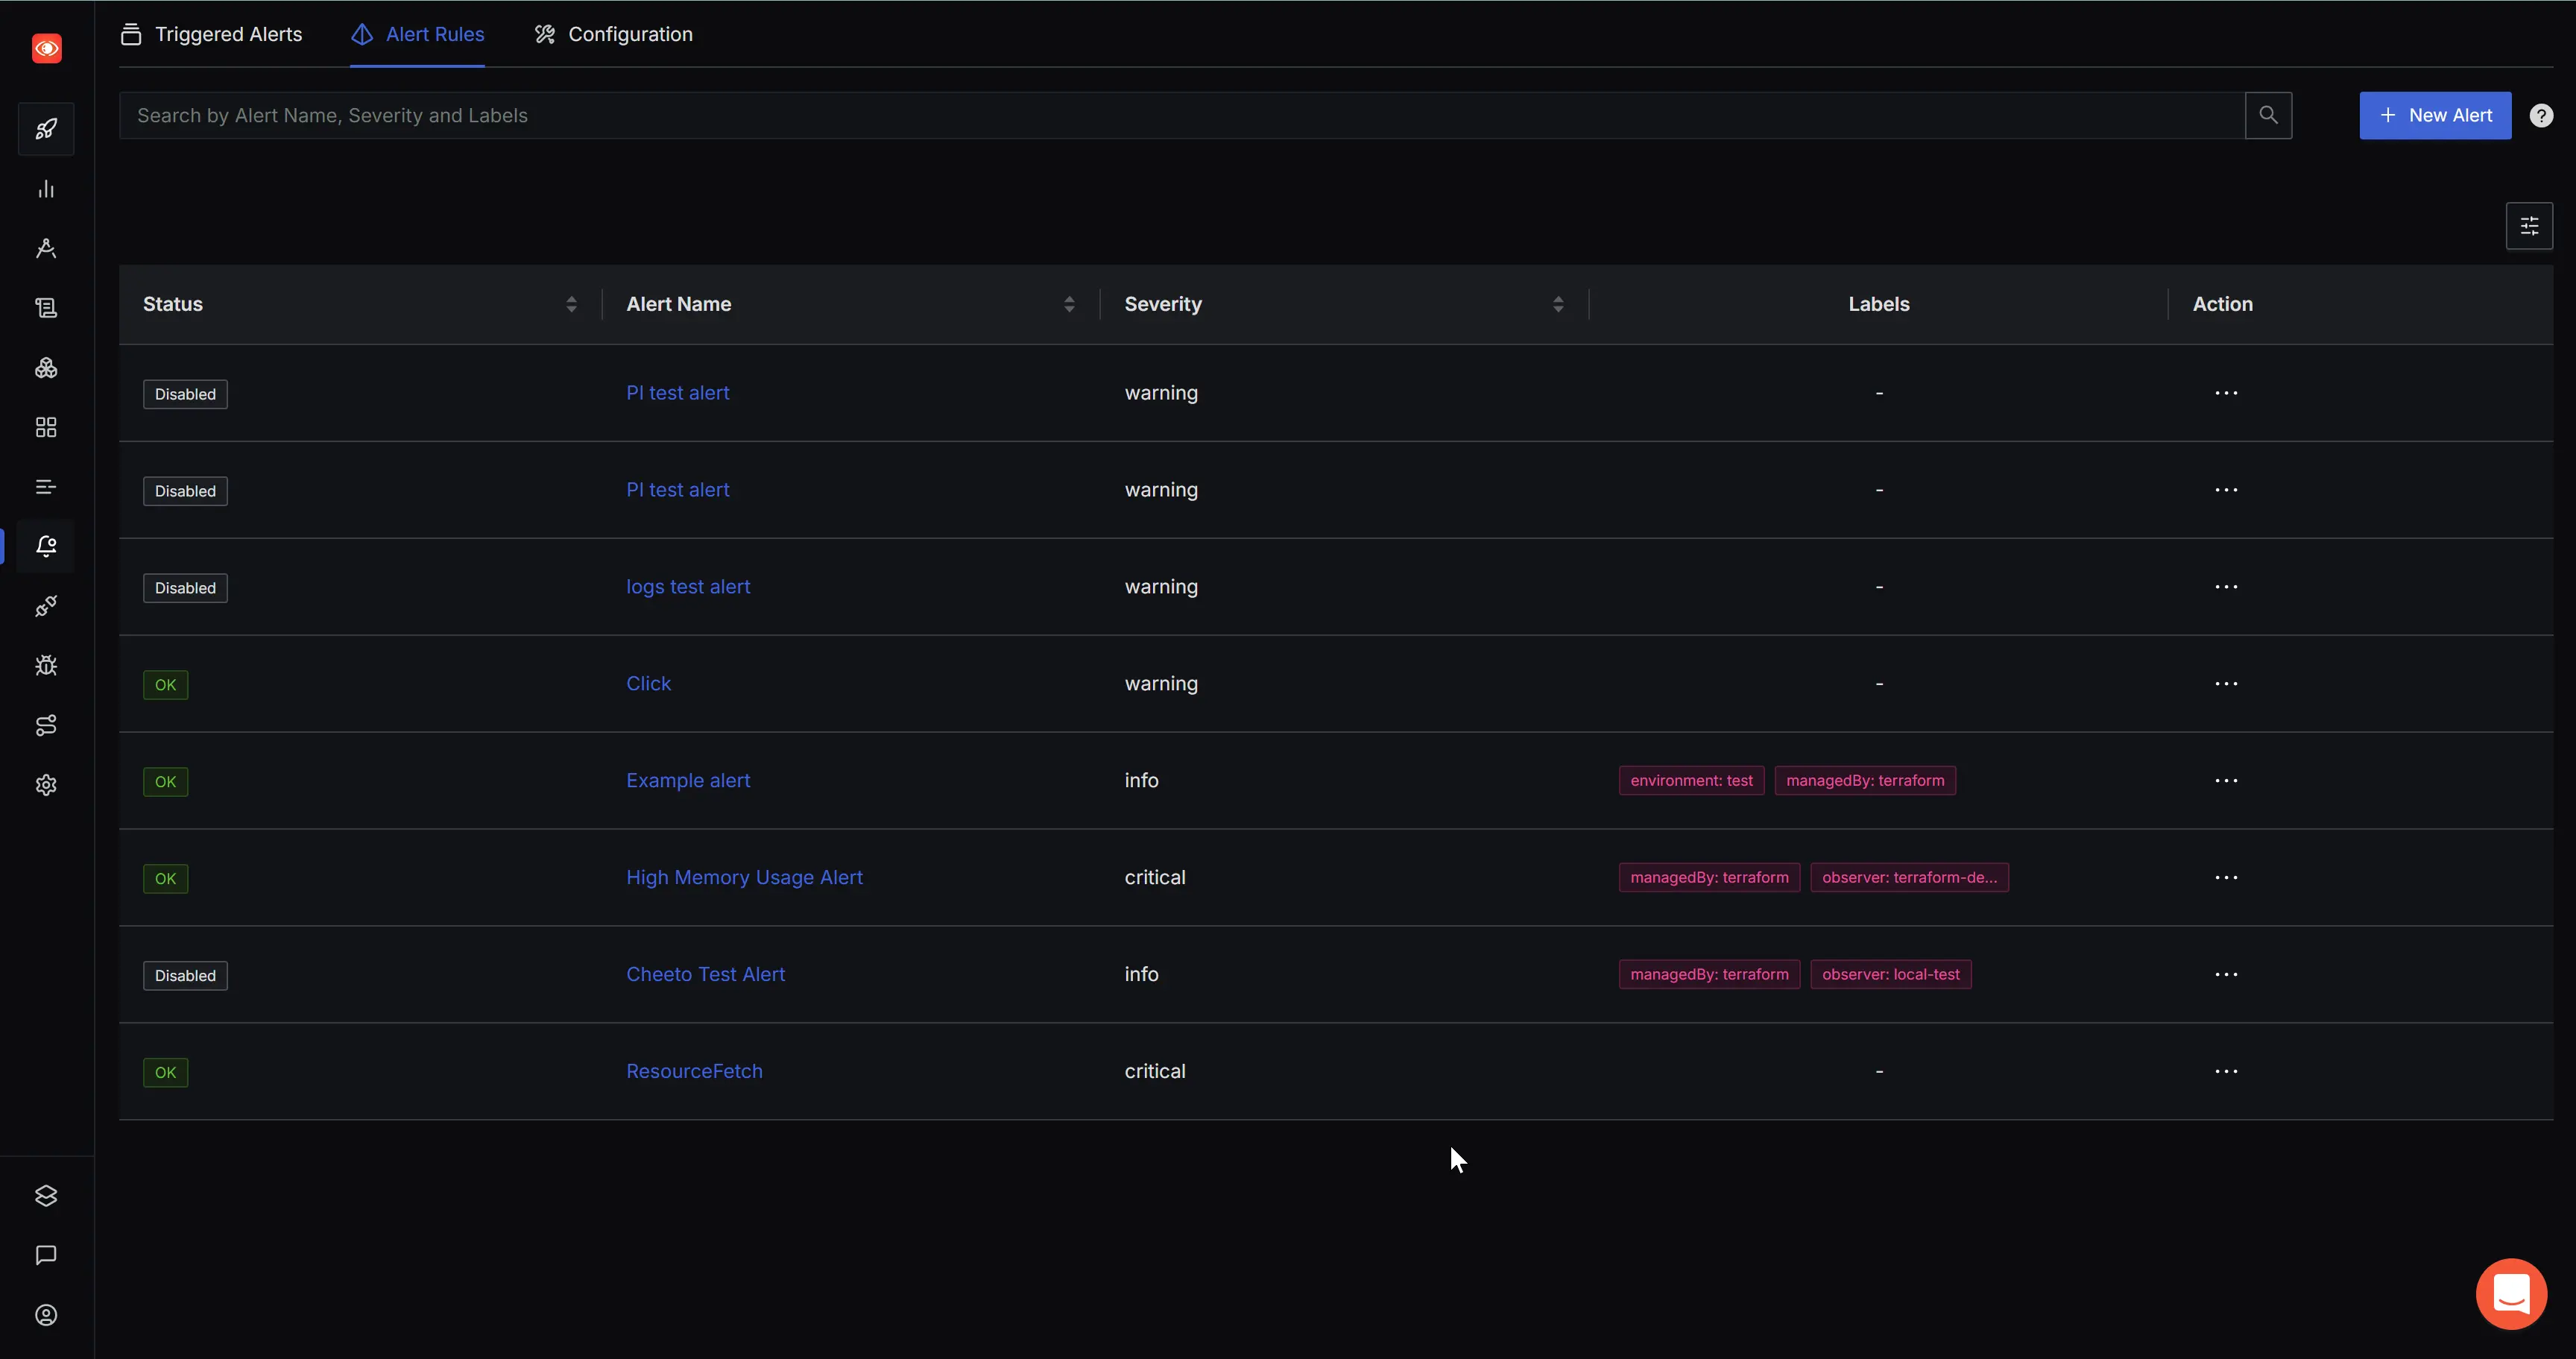
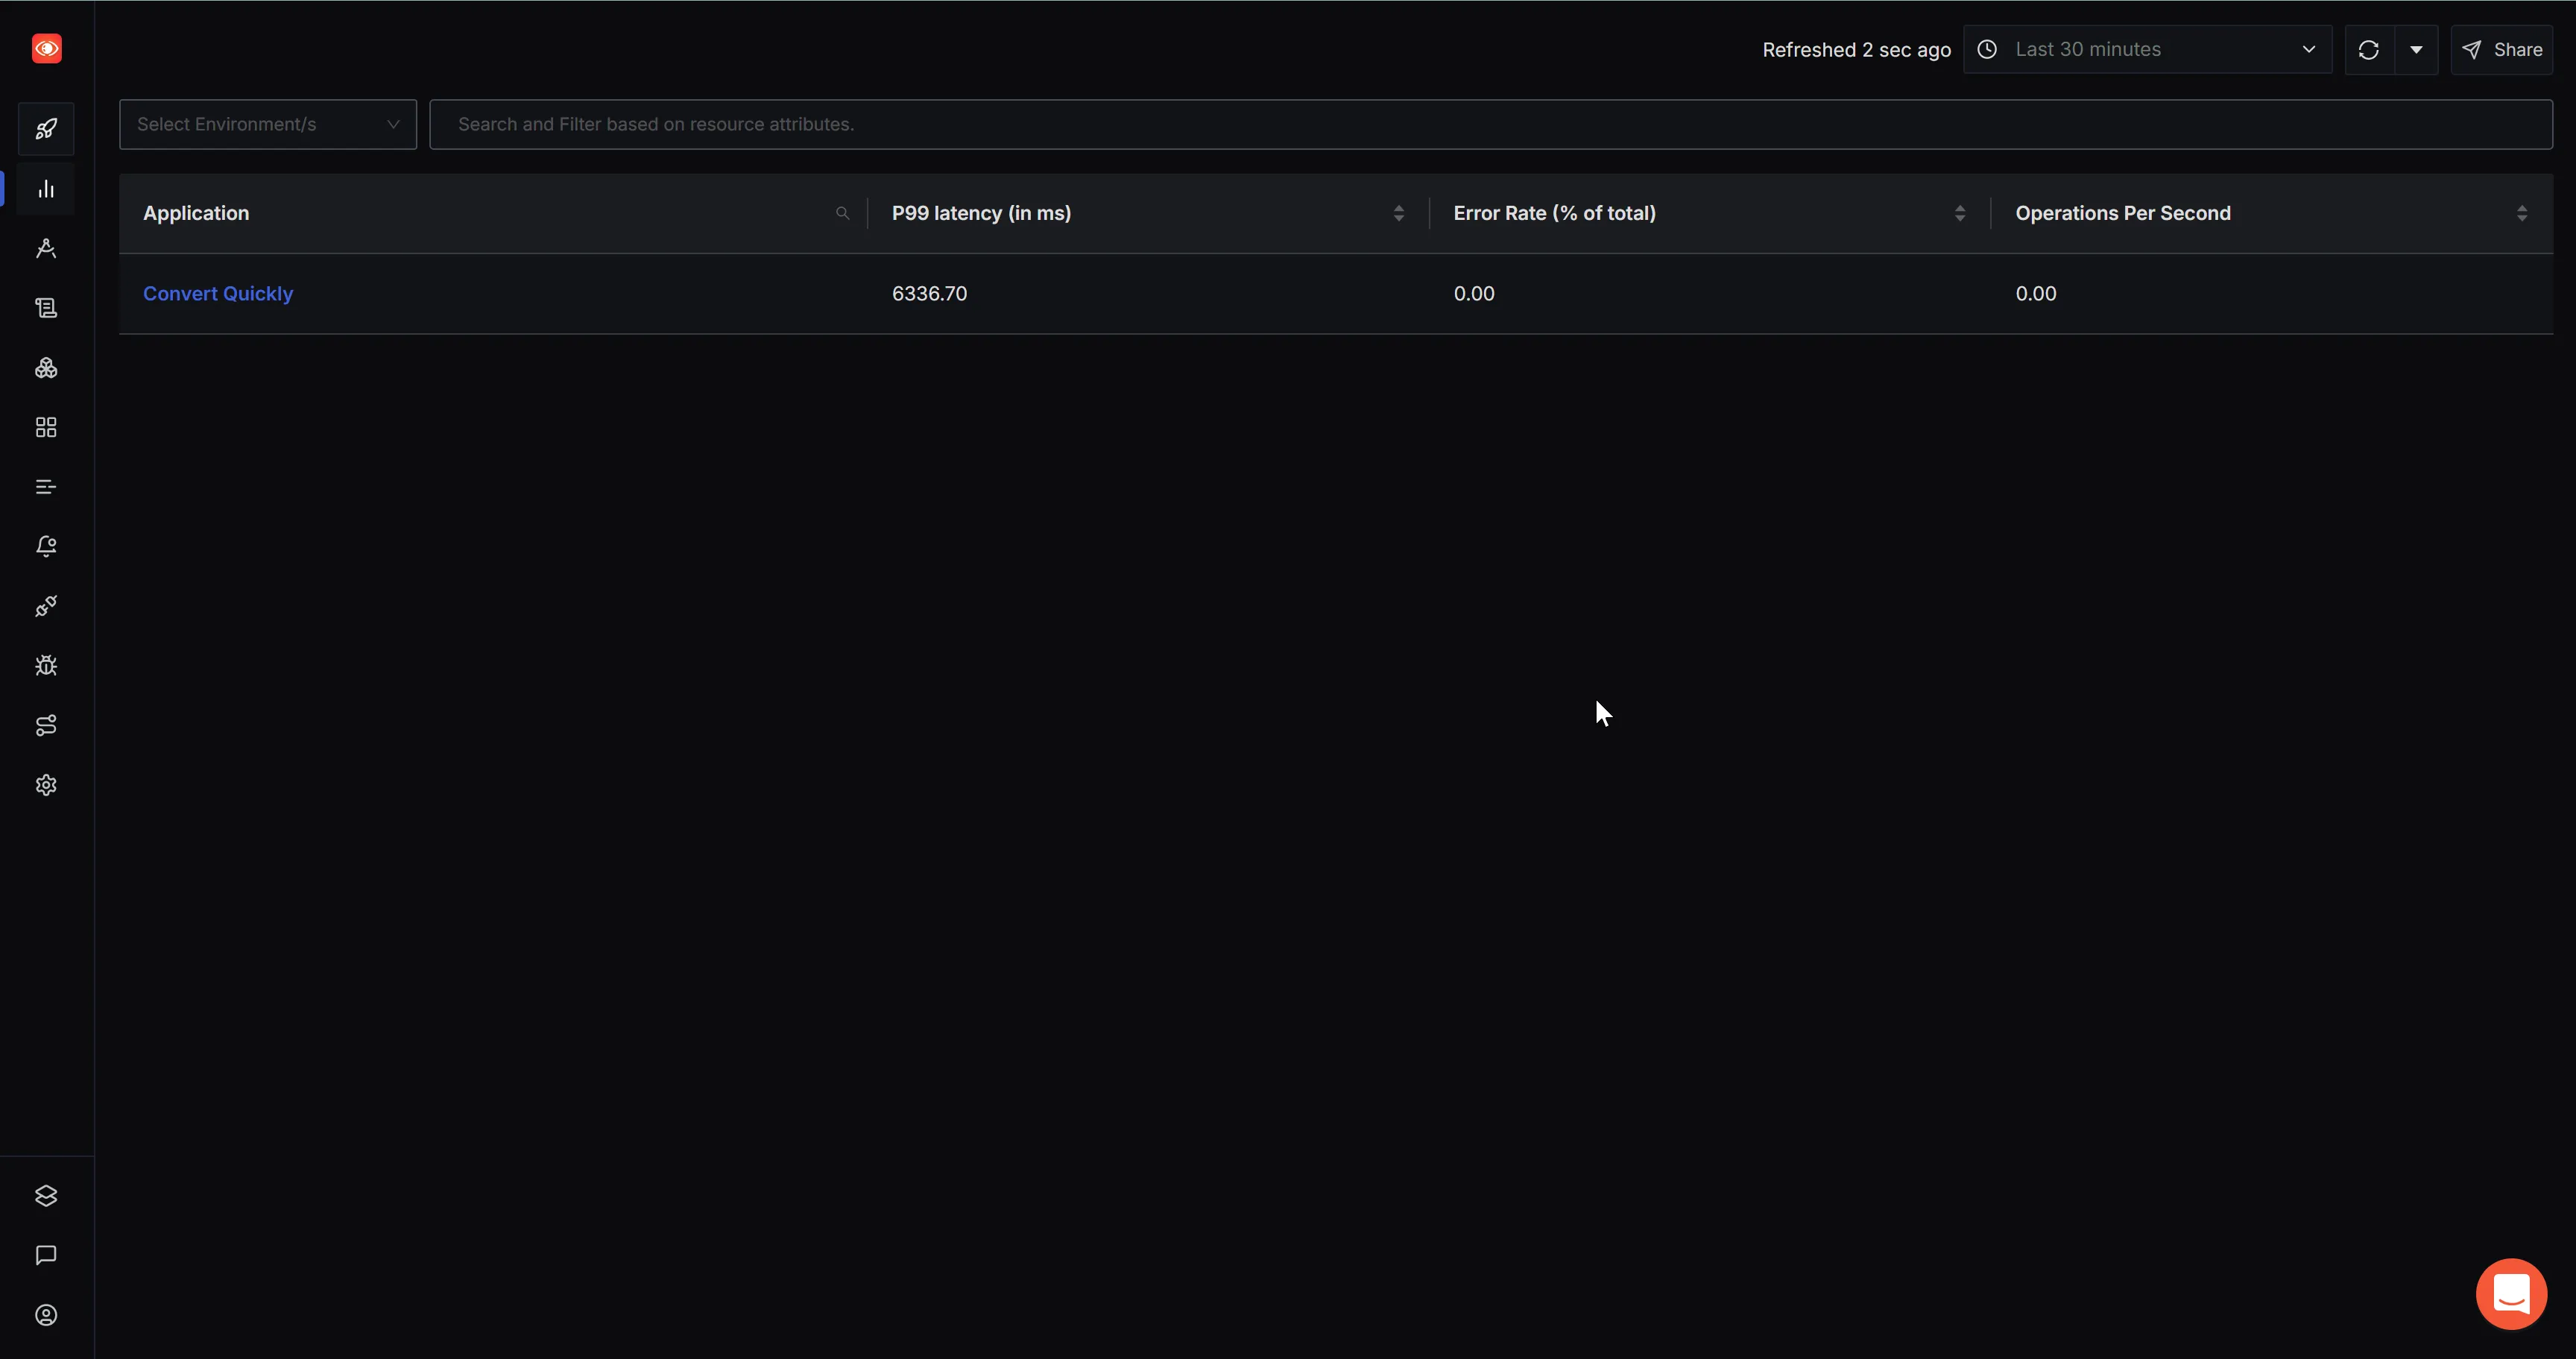
You will now see your application in the Services section in the SigNoz sidebar.
Step 4: Document Load Trace Data
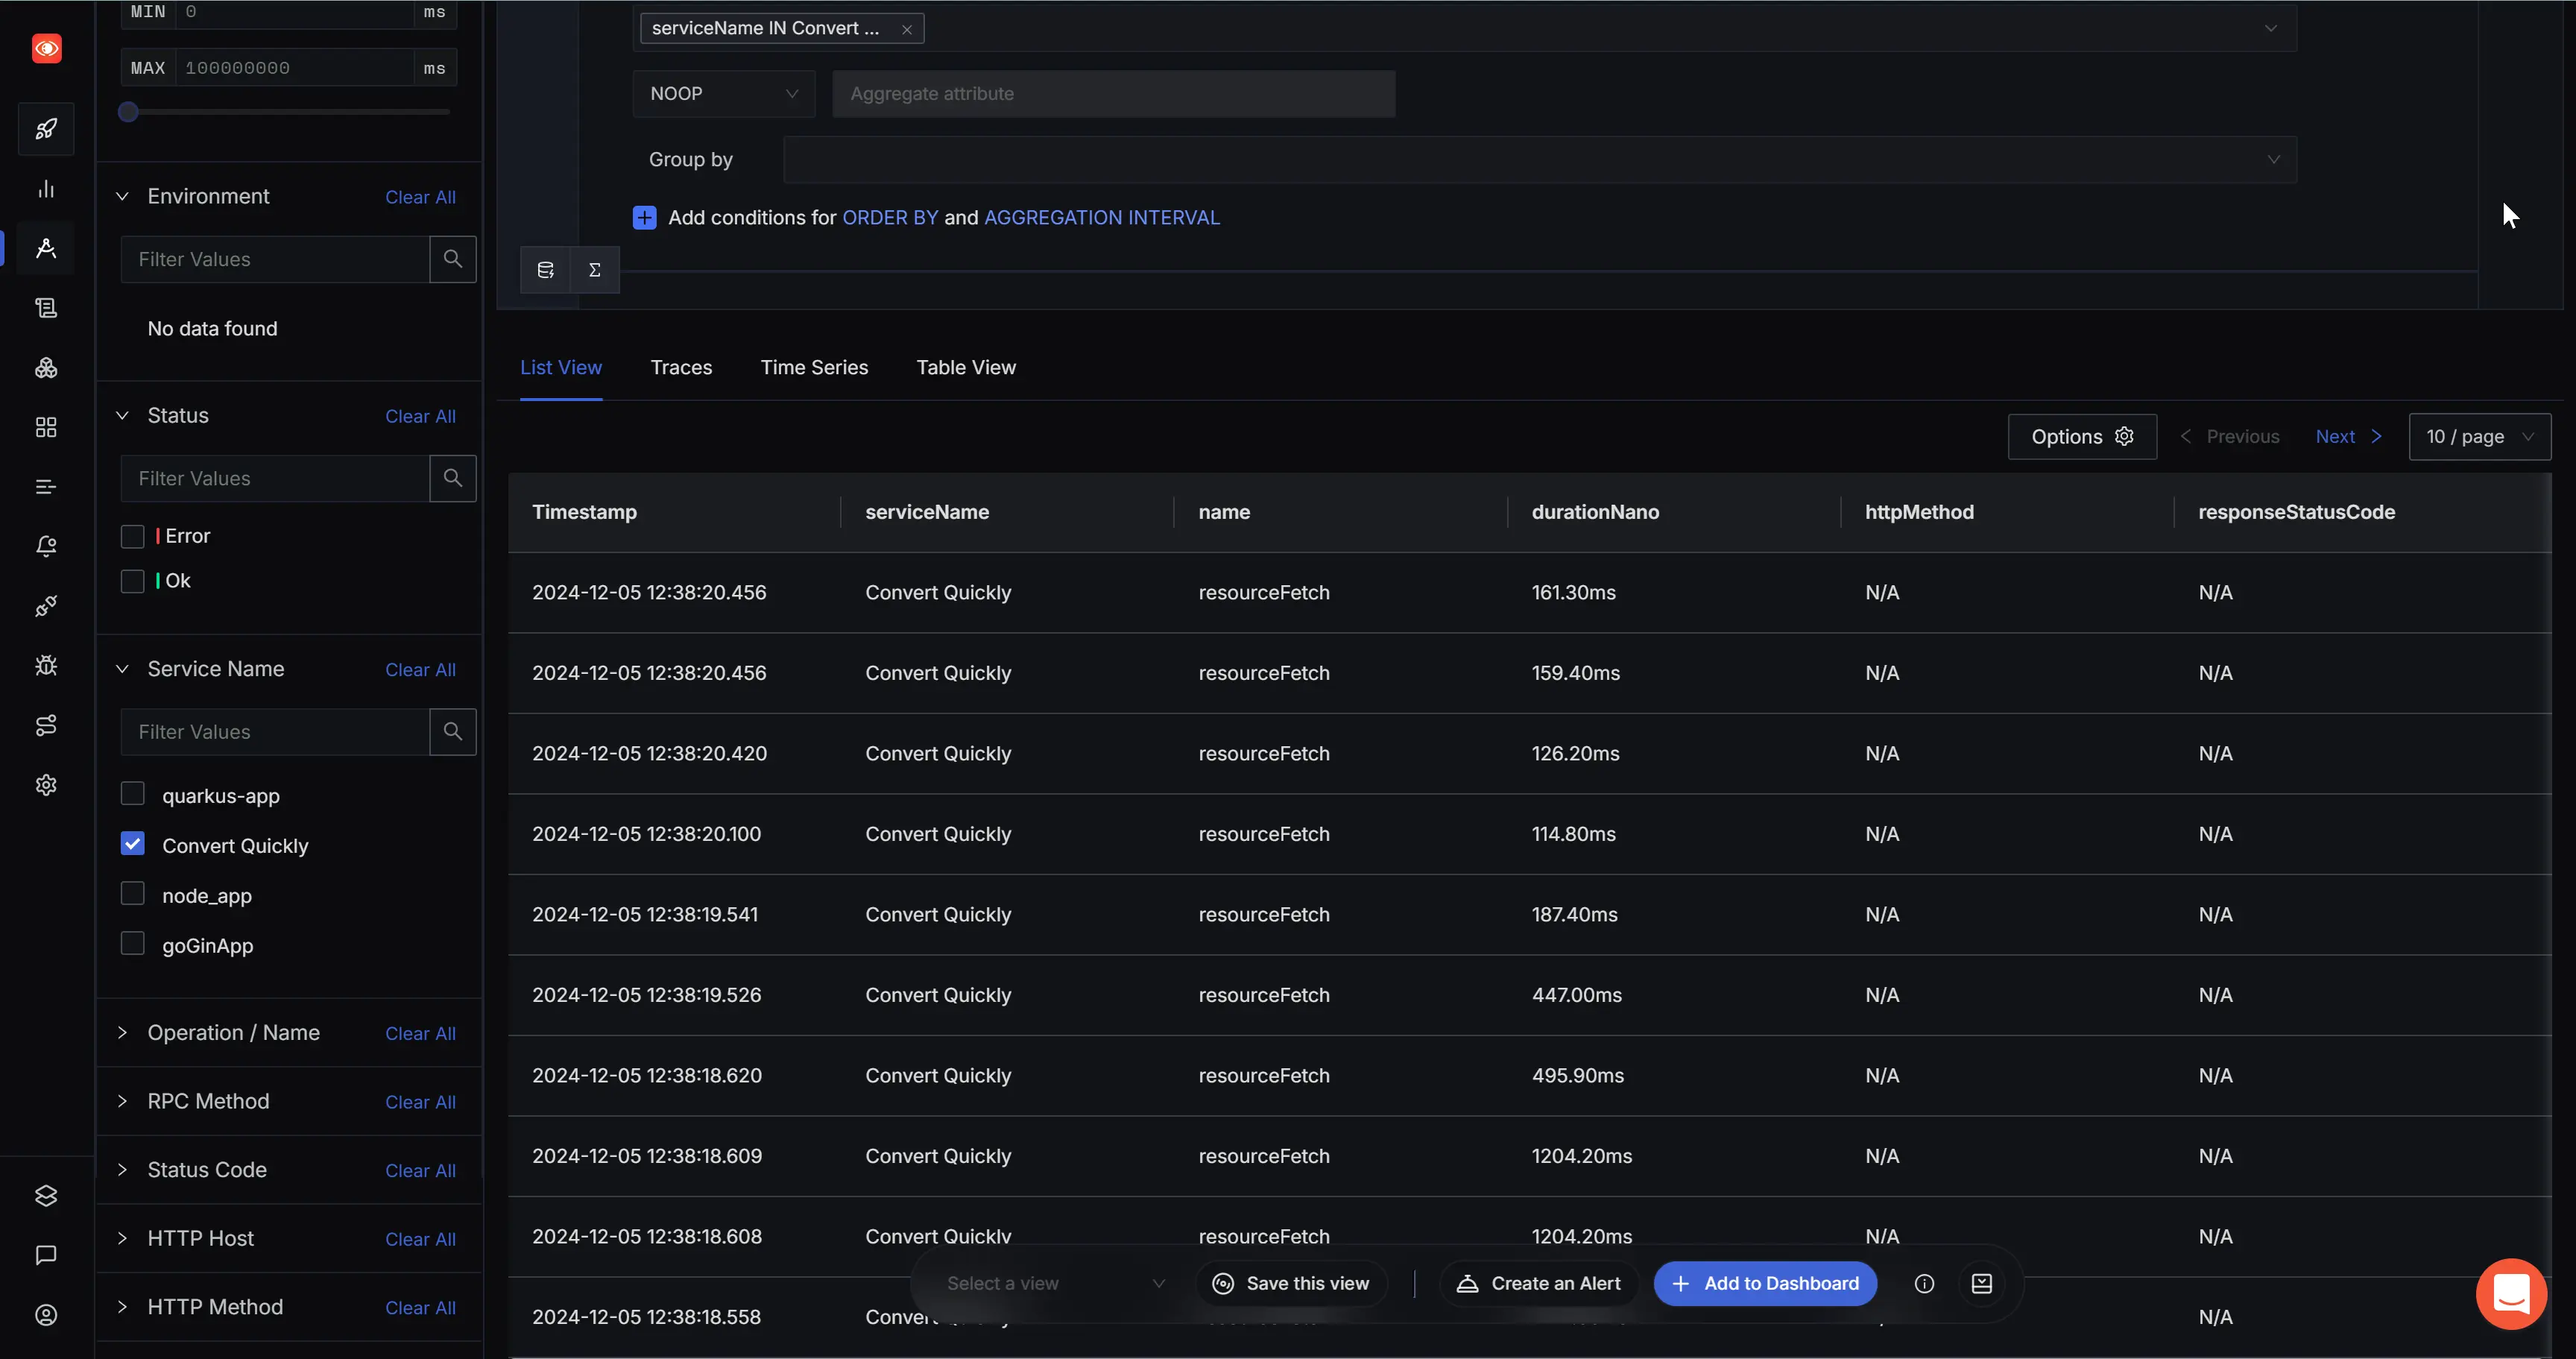
The document load data is automatically captured in the Traces section of the SigNoz dashboard as soon as your application is loaded.
Setup Alerts
Create an Alert
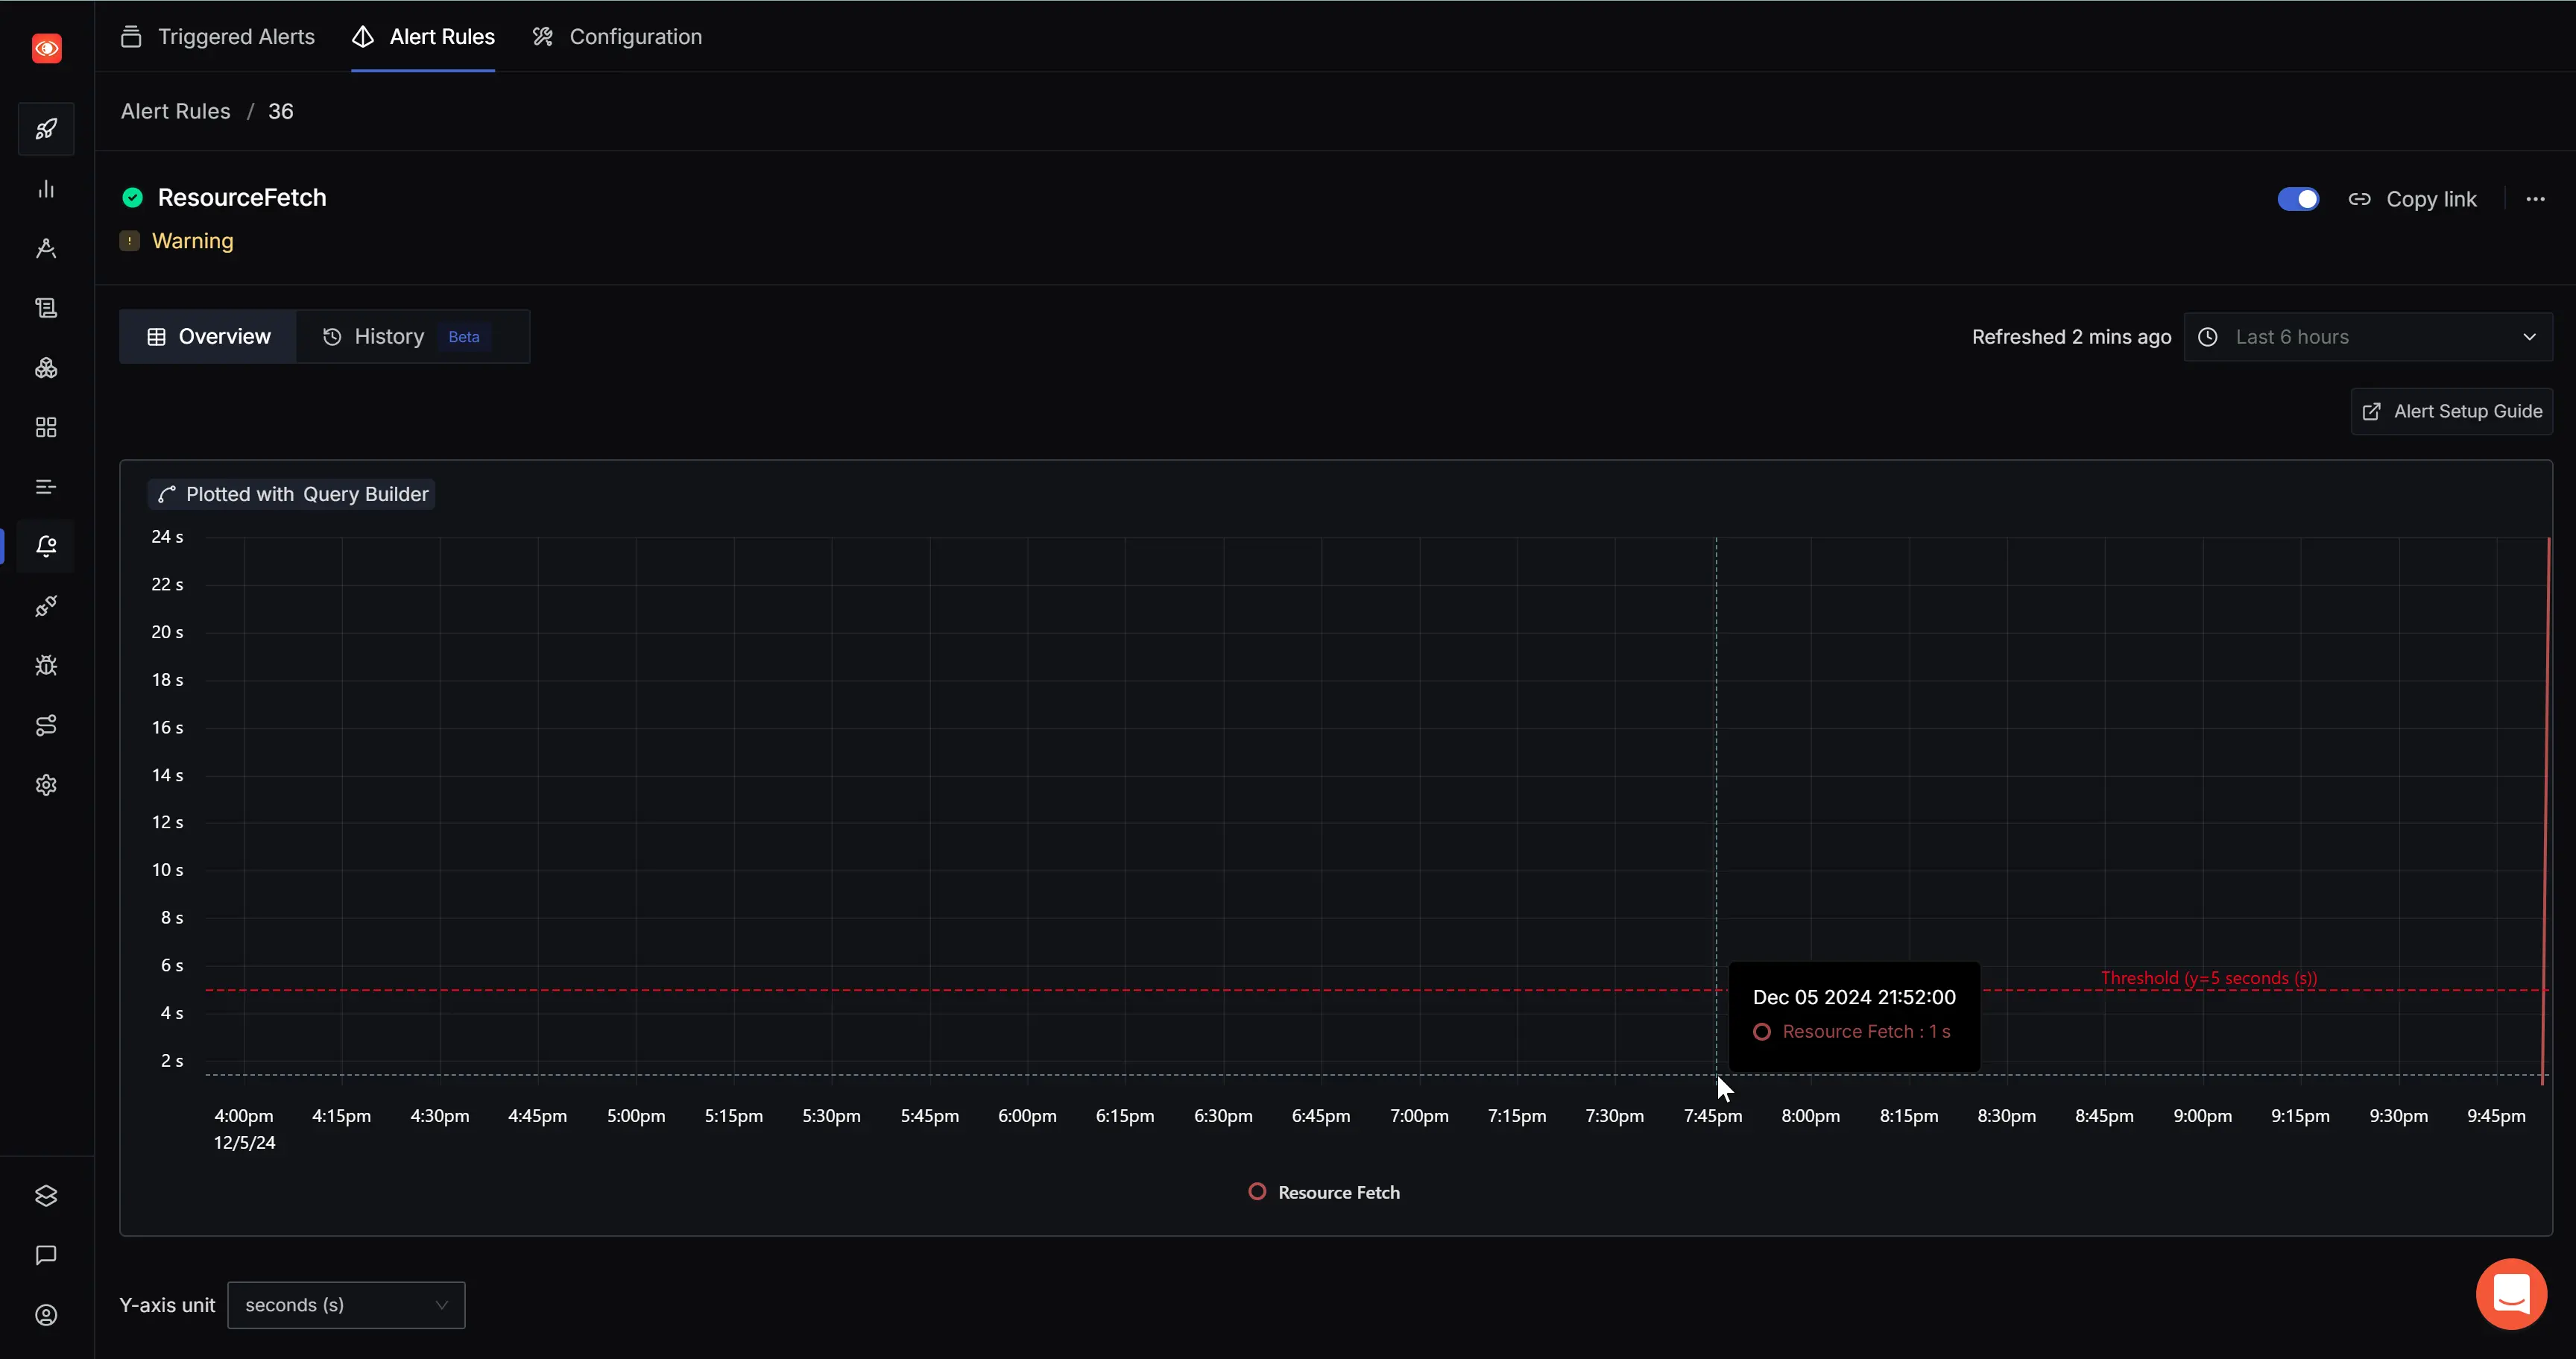
You can create trace-based alerts by using the Create an Alert button in the Save View button at the bottom of Traces section. Alternatively, you can directly create it from the Alerts section. To create and manage trace-based alerts, follow this guide.
In this example, we will set up an alert for ResourceFetch. Resource Fetch reports all the resources, including external scripts, images, style sheets, fonts, and other assets, that are required to render a webpage. Knowing the time it takes to fetch resources will be useful in taking proactive action to optimize your application using caching or other optimization strategies.
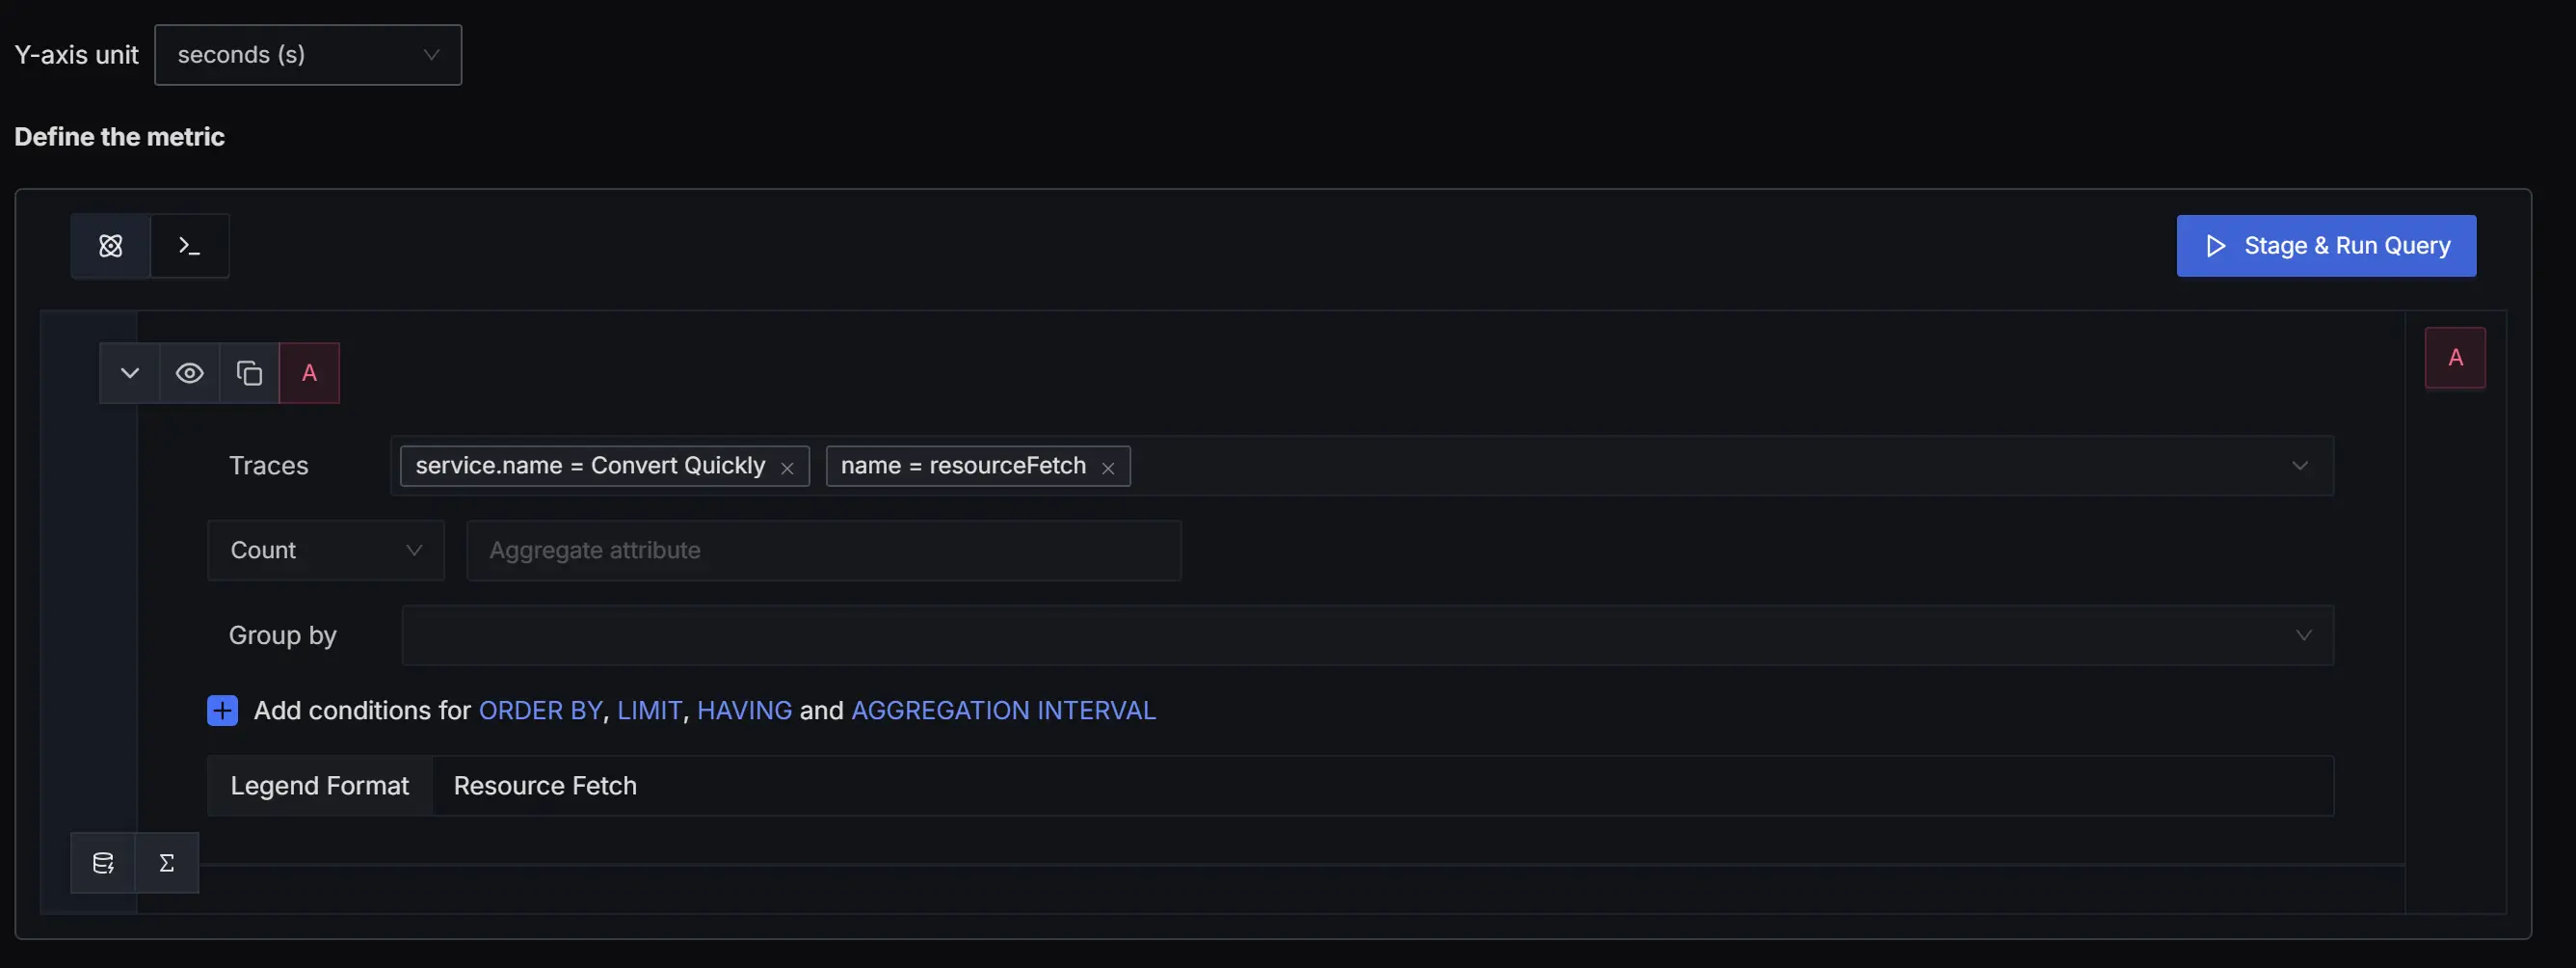
In the Traces Based Alerts page, set the Traces field to service.name = <service_name> and name = resourceFetch . Next, set the Y-axis units to seconds. You can also set the Legend Format to Resource Fetchand then press the Stage & Run Query button.
Define Alert Condition
Define an alert condition with Send a notification when A is above the threshold at least once during the last 5 mins and set the Alert Threshold field to 10 seconds.

Set Alert Configuration
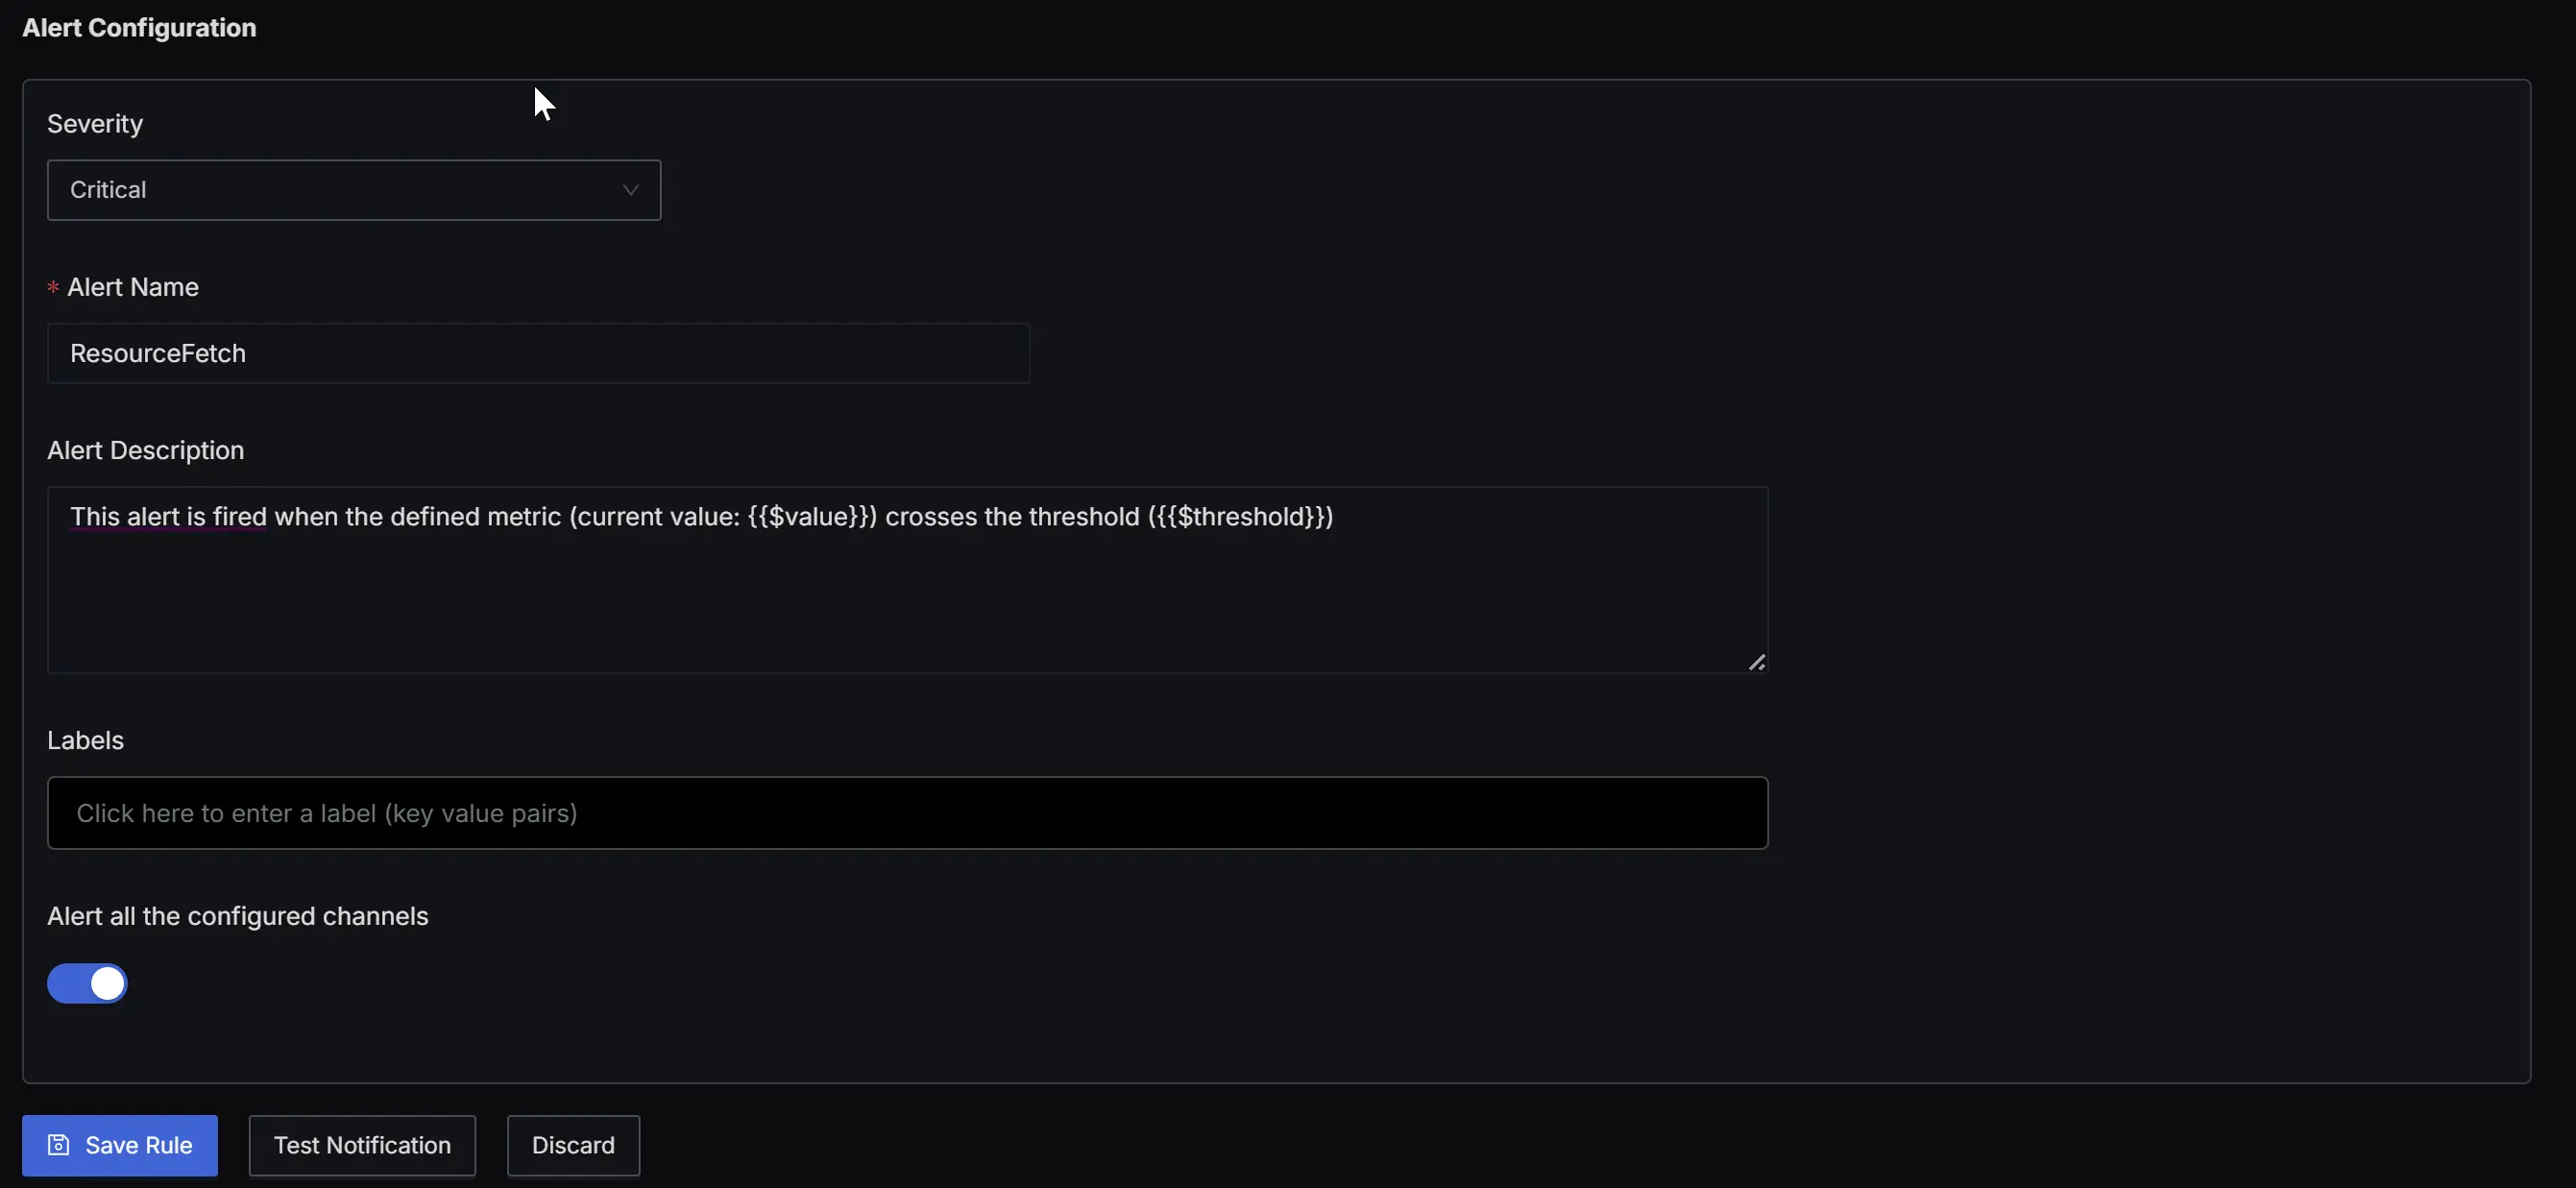
Set the Severity field to critical, the Alert Name field to ResourceFetch, toggle on the Alert all the configured channels field to alert all the notification channels. You can choose to send the alert to a particular notification channel by selecting a particular Notifcation Channel from the dropdown. Save the rule and test the notification.
With this, you have successfully set up a useful alerts on your data.
