How InstaSafe chose SigNoz over Grafana and Elastic APM to power their observability needs
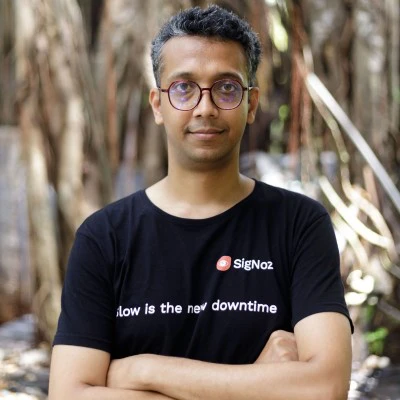
I sat down with Bhaswanth, Software Architect at InstaSafe to understand how they use SigNoz at InstaSafe. Here’s a few snippets from our conversation (edited for legibility)


Can you share about what does Instasafe do? What are your key products?
Instasafe provides Zero Trust Application and Network access products for remote teams. With users from around 40 countries creating around 100,000 authenticated sessions per day, uptime is very important for us.
With huge number of teams suddenly moving to working remotely, Instasafe experienced a surge in demand which amplified the need for a good observability setup.
Why is high uptime important to Instasafe?
Availability of InstaSafe platform is critically important as our customers ability to do business depends on InstaSafe’s connectivity. Maintaining an uptime of 99.99 or 5 nines is important to us.
Bhaswanth says “For large sites, availability is very important because our customers' applications are dependent on our connectivity.”
What are your key use cases in Observability
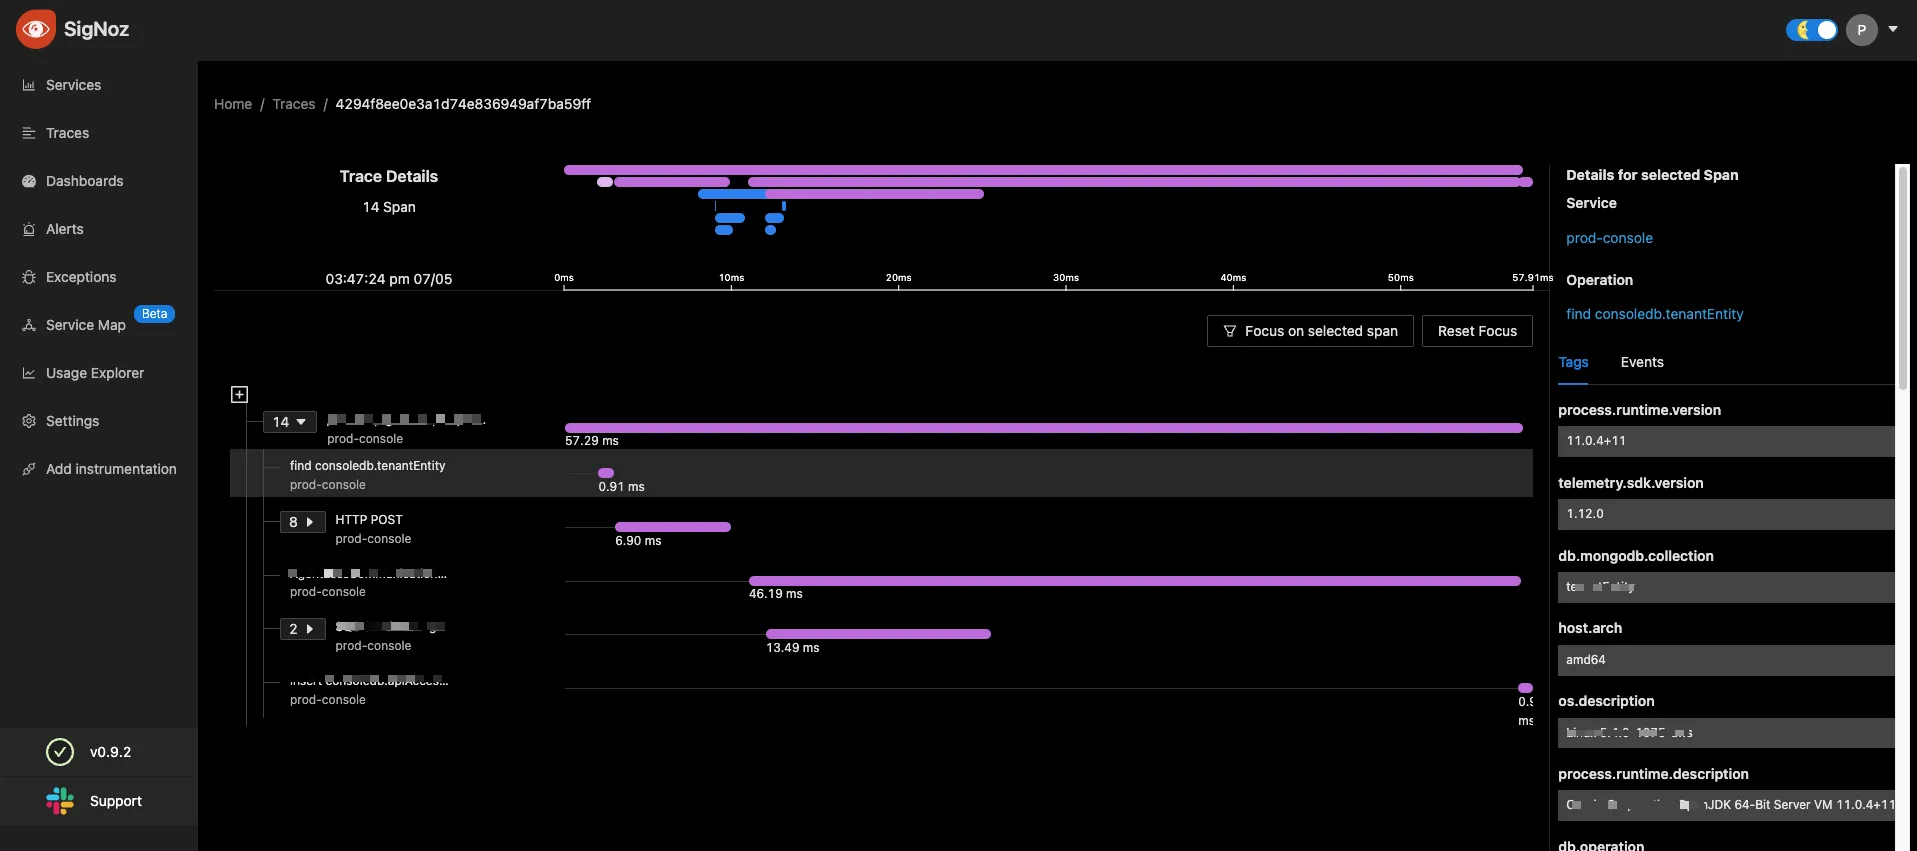
“We observed that some of our APIs, they take a lot of time to process. We could not figure out why. Because when we test in our own environment everything seems fine. But we don't do it at scale of the customers, right”
And what is the P99 latency? Such things. We didn't know how our applications did on such metrics before.”

What tools did you try before moving to SigNoz?
“So we tried a lot many things like Grafana or Jaeger. Different platform for different needs - Grafana + Prometheus for Metrics, Jaeger for traces. One major challenge that we faced especially is the maintenance of these platforms” says Bhashwanth.
Combining different platforms for Metrics and Traces made configuring and maintaining these platforms non trivial and difficult to maintain.
“Actually we tried ELK also. It was easier to deploy. But the challenge is the scale.
How much ever resources we had ELK was eating up all of it and was very slow. It was not usable for us. So we had to move out of ELK”


What did you like about SigNoz?
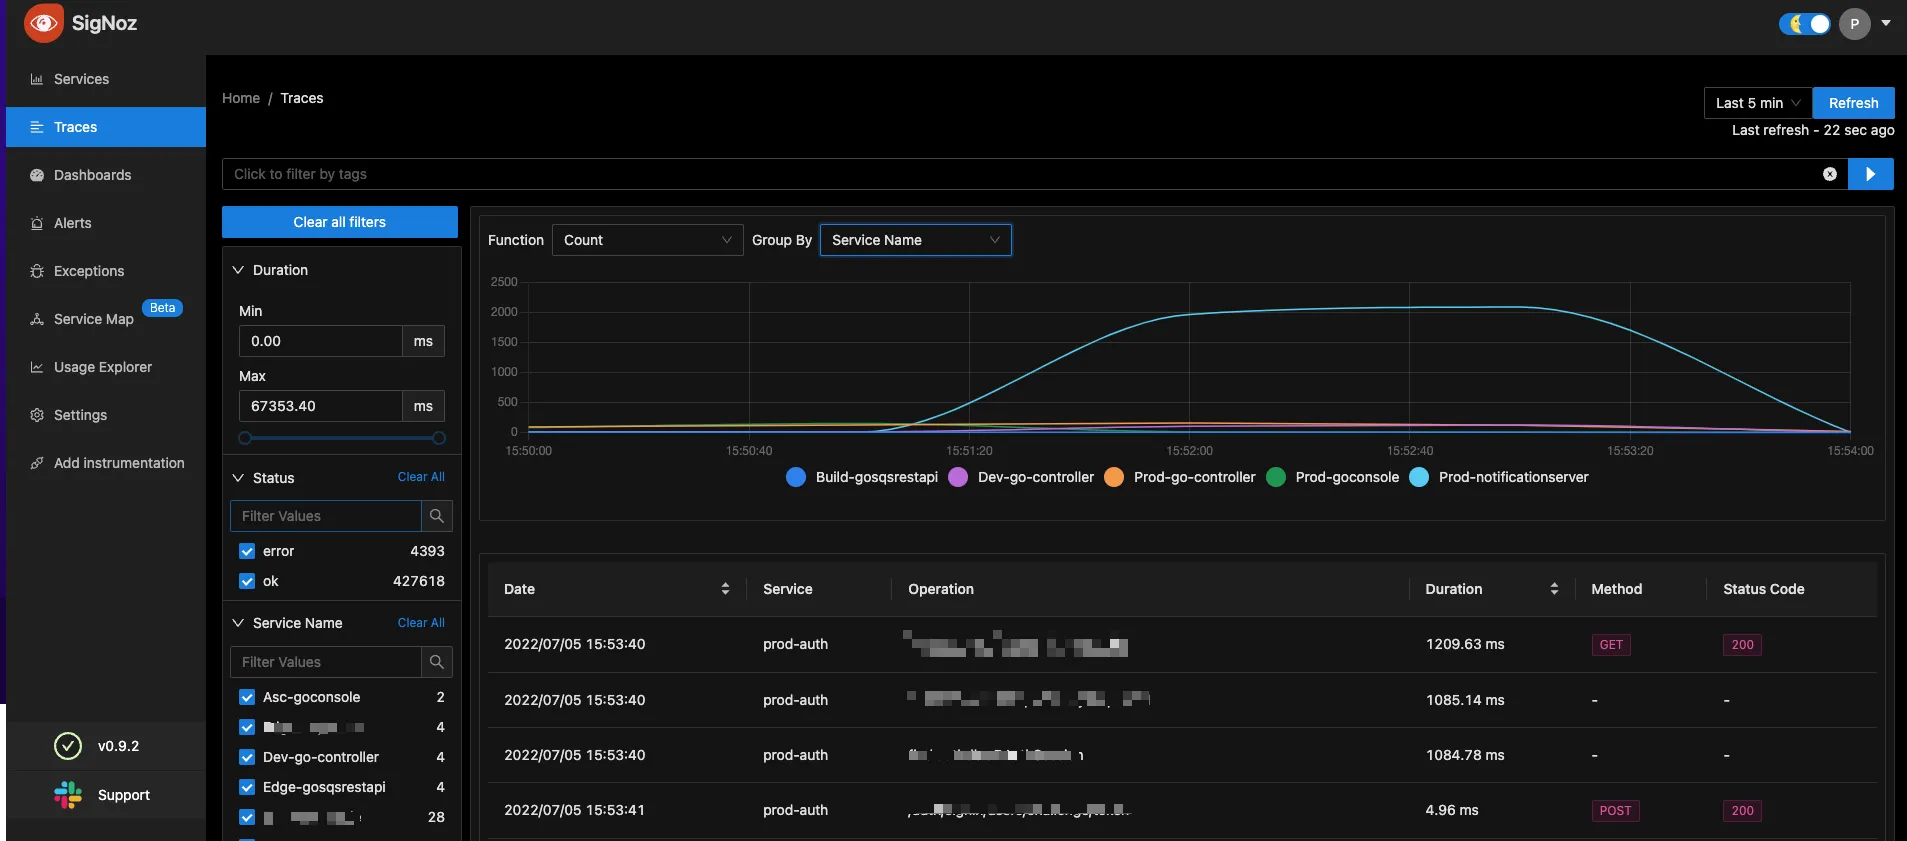
“I was looking for common platforms and exploring some upcoming open source tracing products. Then I found out SigNoz.I thought to give it a try. I think I spent around maybe 20-30 minutes to apply and everything was up. End to end. It's not just the server side metrics, but including the endpoint latencies, et al. So I was able to run a script and then configure everything.”
”This was the turning point for me to look at the SigNoz. What I liked was that you have both metrics and traces and logs in the roadmap potential one. And second, simplicity and easier to maintain for a team like ours.”
Any advice for new teams which are thinking of setting up their Observability systems or upgrading them?
“I think one mistake, which I have done in that past is - that when we look at a platform we want to use all its feature rather than thinking what problem is it solving for us. If we start collecting data for something which we don’t need now, but may be in the future - it might just add more load to the system, without giving us any benefit today - and may lead to bottlenecks.”
So, I would suggest to understand what data do you need today - and only send that data to the platform.
Thank you for taking out the time to read this case study. If you have any feedback or want to share your story using SigNoz, please feel free to reach out to [email protected] with Case Study as subject.
Sharing stories of how different teams are using SigNoz helps the community in learning different use cases and problems SigNoz can solve and also showcases how you are solving issues in a unique way.
Feel free to join our slack community and say hi! 👋


